
If you have spent any time around Bitcoin cycle charts, you have seen the MVRV Z-score: a jagged line that spikes near every top and dips below zero near every bottom. This guide explains what it actually measures, how to calculate it, what it read at every cycle since 2012, and the change in its behaviour that anyone still using the old thresholds needs to know about.
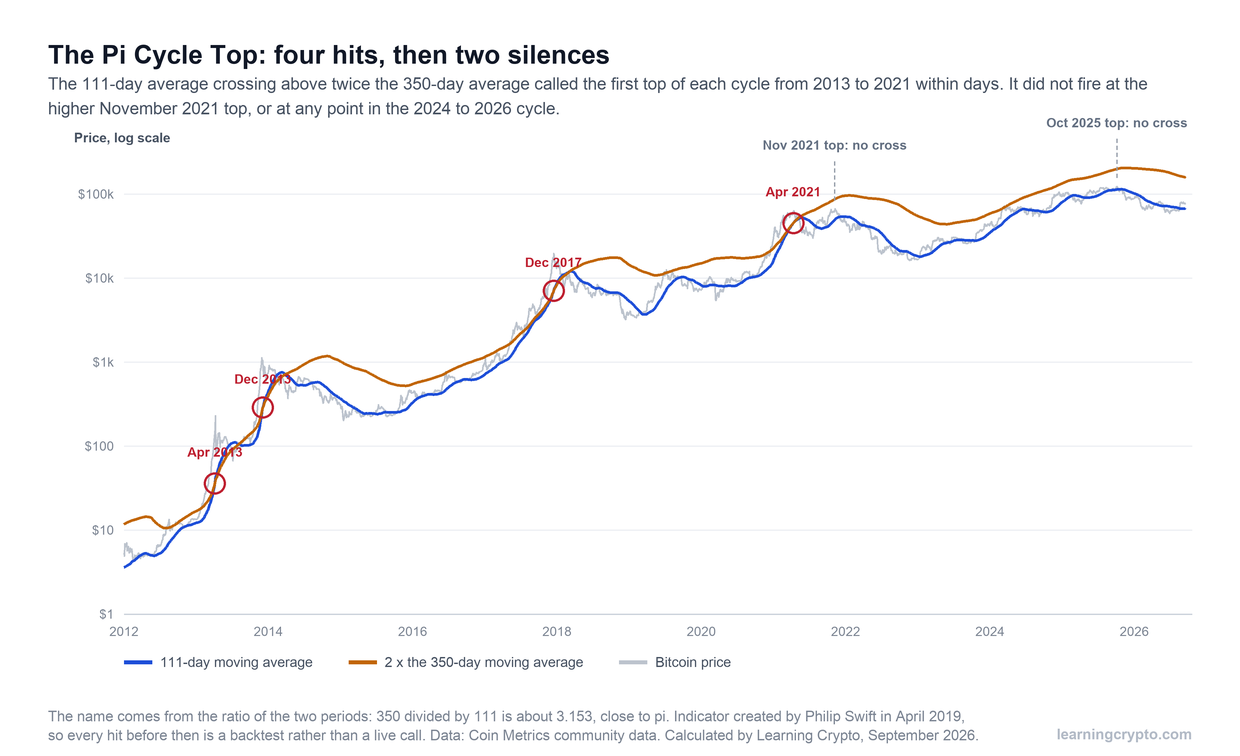
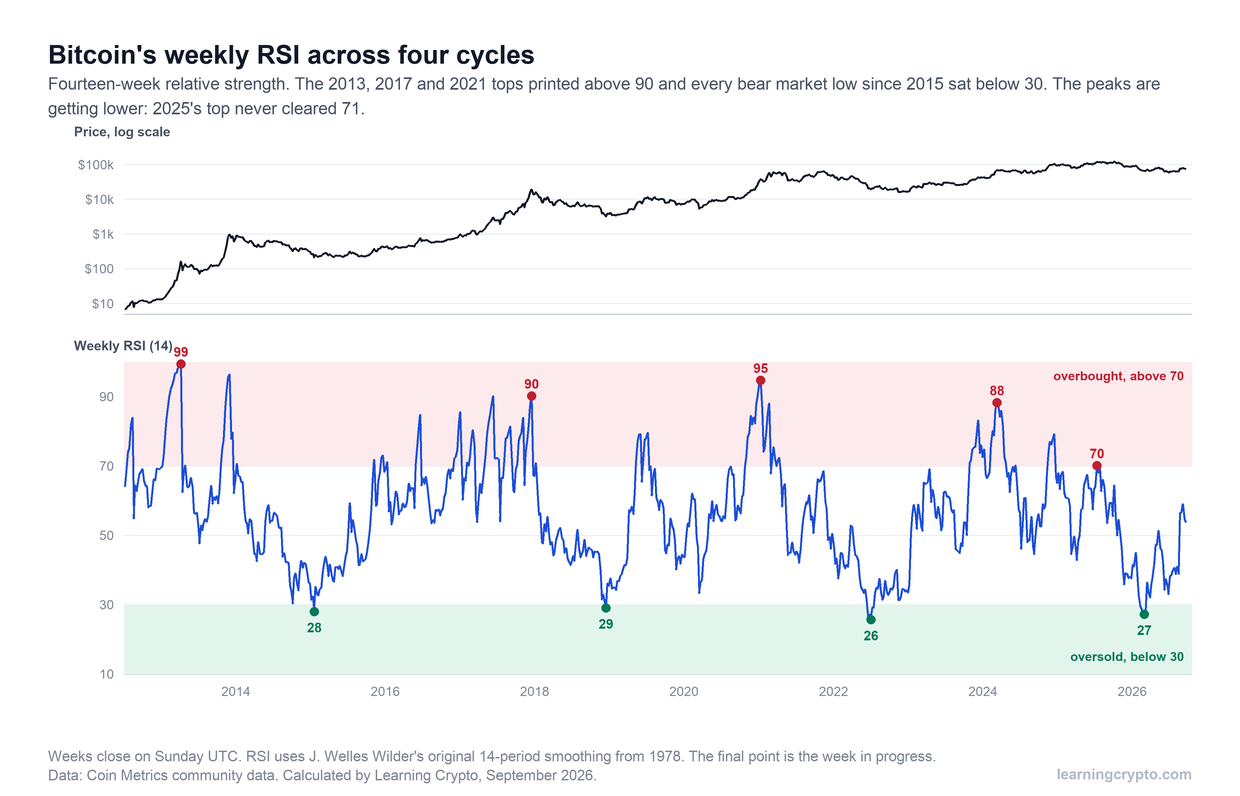
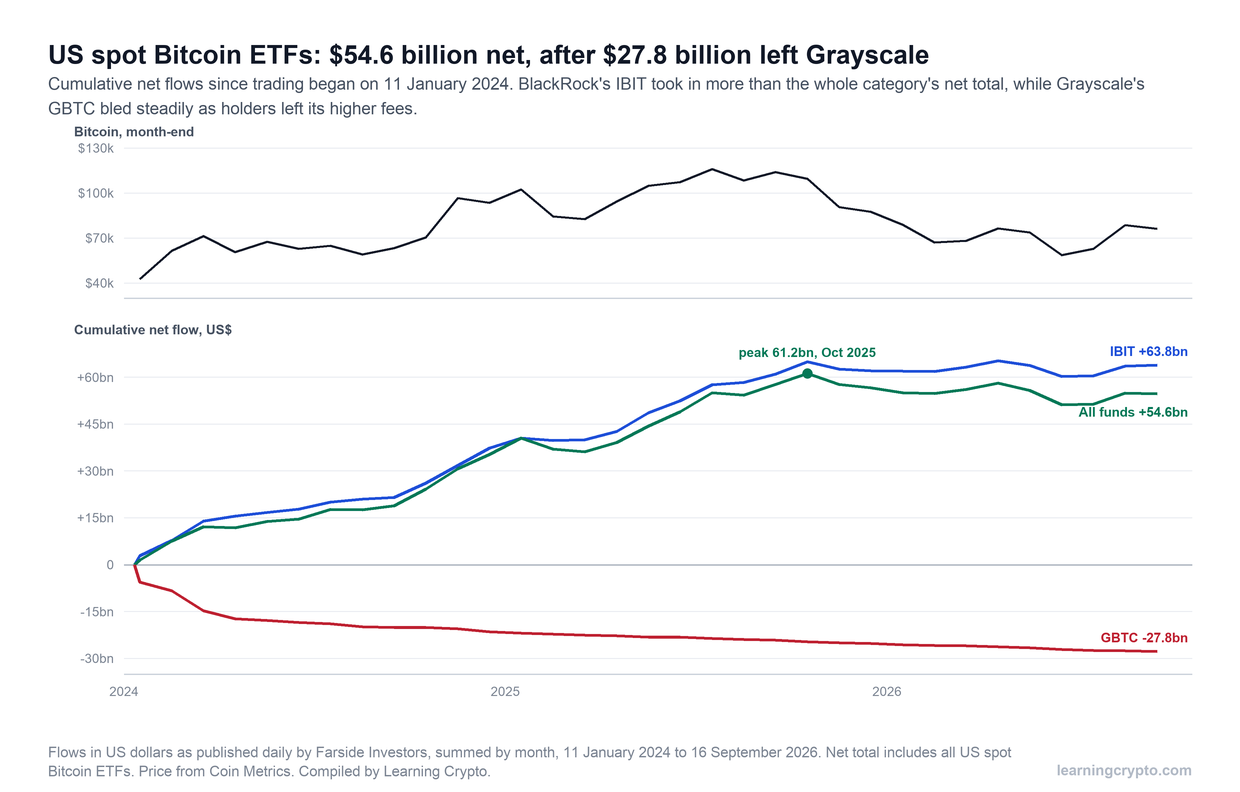
It is one of five guides to the inputs behind the Satoshi Indicator, alongside the Pi Cycle Top, Bitcoin's weekly RSI, the Fear and Greed Index and spot ETF flows.
This is education, not financial advice. The history below describes what happened, not what will happen, and every indicator here has been wrong at least once. Figures were calculated by Learning Crypto from public data in September 2026.
What is the MVRV Z-score?
The MVRV Z-score measures how far Bitcoin's market value has run ahead of, or fallen behind, the price holders actually paid for their coins, expressed in standard deviations. A reading near zero means the market is valued close to its aggregate cost. A high reading means the market is worth far more than holders paid, which historically is when they sell. A negative reading means the average coin is worth less than its owner paid for it.
Its name is three ideas stacked together. MV is market value, the familiar market capitalisation. RV is realized value, a different way of valuing the same coins that is explained below. The Z turns the gap between them into a standardised score, so a reading from 2013 can be compared with one from 2026 even though Bitcoin's price is several hundred times higher.
It belongs to the family of on-chain valuation tools covered in our on-chain analysis guide. Its appeal is that it uses information only a blockchain can provide: when every coin last moved, and at what price.
What is realized cap, and why does it matter?
Realized cap values each coin at the price it had when it last moved on the blockchain, rather than at today's price. A coin bought at $20,000 and never moved counts as $20,000 in realized cap, even with Bitcoin at $76,000. Add that up across every coin and you have a rough estimate of what the whole market paid, which makes it the closest thing Bitcoin has to a cost basis.
The idea came from Nic Carter and Antoine Le Calvez at Coin Metrics, who introduced realized capitalization in 2018. It has a useful side effect. Coins lost forever in 2011 were valued at a few dollars when they last moved, so they barely count in realized cap, while in ordinary market cap they count at full price. Realized cap quietly discounts coins that nobody will ever sell.
Market value divided by realized value is the MVRV ratio, introduced by Murad Mahmudov and David Puell later in 2018. In mid-September 2026 it stood at 1.43, meaning Bitcoin's market was worth about 43% more than holders had paid for it.
How is the MVRV Z-score calculated?
Take market cap, subtract realized cap, and divide the result by the standard deviation of market cap across Bitcoin's history to that date. That is the whole formula. The subtraction measures how much unrealised profit is sitting in the market in dollars. The division puts that dollar figure in context, so a $500 billion gap means something different when the market is worth $100 billion than when it is worth $1.5 trillion.
| Step | What it is | Mid-September 2026 |
|---|---|---|
| Market cap | Every coin at today's price | About $1.53 trillion |
| Realized cap | Every coin at the price it last moved | About $1.07 trillion |
| The gap | Unrealised profit across the market | About $460 billion |
| Divided by | Standard deviation of market cap, all history to date | Scales the gap for volatility |
| Z-score | The result | 0.75 |
One practical warning. Providers compute realized cap slightly differently, and some use a different window for the standard deviation, so the same day can show different Z-scores on different sites. The shape of the history agrees closely; the exact peaks do not. Our figures below are calculated from Coin Metrics' free community data, and the popular chart maintained by Philip Swift at Bitcoin Magazine Pro is a good second opinion. Compare shapes between providers, not decimals.
What has the MVRV Z-score shown across Bitcoin's cycles?
Two things, and the second matters more than the first. At every major low since 2015 it dipped below zero, and at the 2013, 2017 and early 2021 tops it rose above 7. But each cycle's highest reading has been lower than the last, and the current cycle never came close to the old top zone.
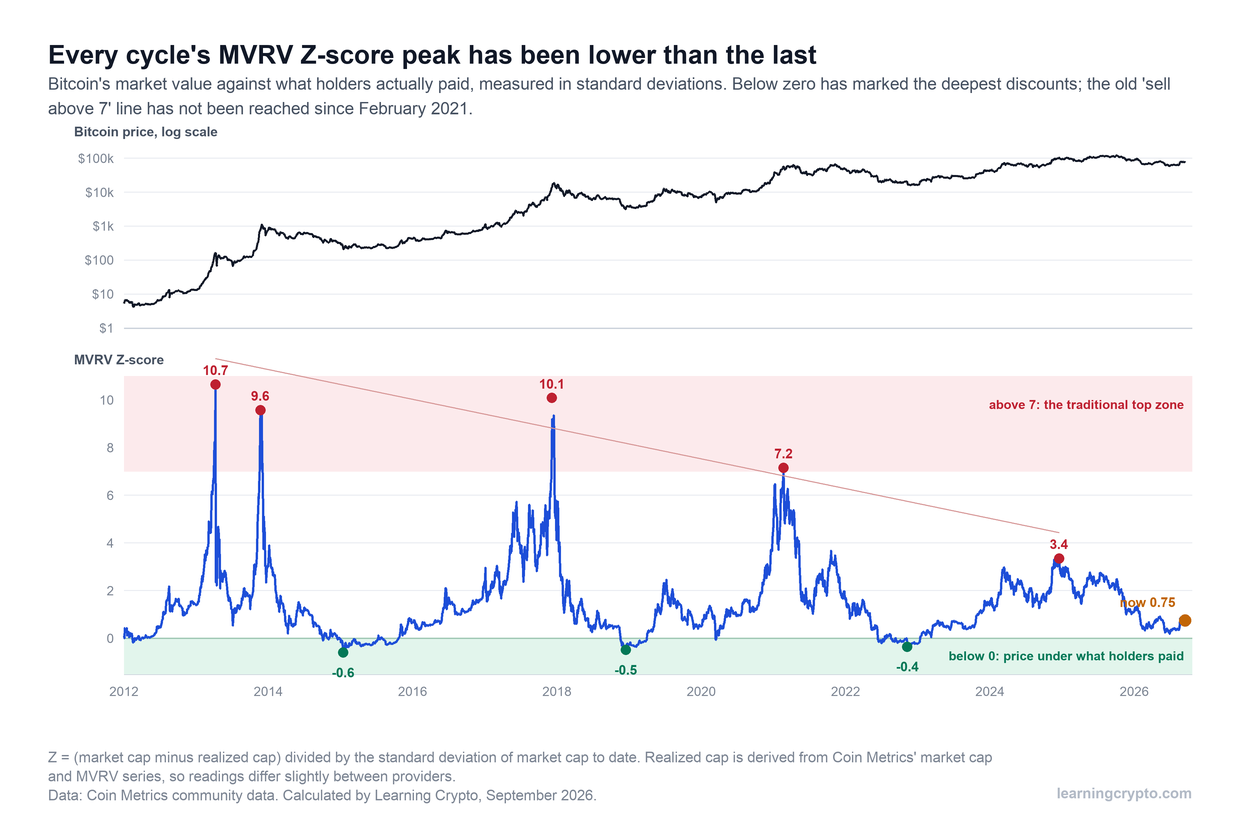
The shaded bands are the traditional reading: below zero is cheap, above 7 is a top. The lower band has kept working. The upper band has not been reached since February 2021, because each cycle's peak has been lower than the one before.
| Moment | Z-score | Bitcoin price that day |
|---|---|---|
| April 2013 top | 10.7 | $231 |
| November 2013 top | 9.6 | $803 |
| January 2015 low | -0.6 | $176 |
| December 2017 top | 10.1 | $17,032 |
| December 2018 low | -0.5 | $3,185 |
| February 2021 peak | 7.2 | $57,501 |
| November 2021 top | 3.5 | $67,542 |
| November 2022 low | -0.4 | $15,758 |
| December 2024 peak | 3.4 | $105,856 |
| October 2025 top | 2.5 | $124,824 |
| June 2026 low | 0.2 | $58,525 |
Read down the right-hand column and the pattern is plain. The score peaked in February 2021, not at the higher prices of November 2021. The highest reading of the latest cycle came in December 2024, ten months before Bitcoin's highest close. And the sell-off to June 2026, a 53% fall from the top, never pushed the score below zero at all.
Why has the top signal faded?
Because the thing being measured has changed shape. In 2013 and 2017 a small market ran far ahead of a small cost base in a few months, and the gap between market value and realized value blew out to ten standard deviations. As Bitcoin has grown, a larger share of coins has been bought at high prices and held, so realized cap has risen closer to market cap, and the swings have been measured against a much larger history of volatility.
Several things push in that direction at once. Long-term holders sell into rallies more steadily rather than all at the end. Spot ETFs and corporate treasuries have added large buyers whose cost basis sits near recent prices. And the standard deviation in the formula keeps accumulating the enormous early swings, which makes the same dollar gap look smaller every year.
The practical consequence is that anyone still waiting for a reading above 7 before taking profit waited through the whole of the last cycle. The lower threshold has kept working because it describes something structural: the market valued below what holders paid. The upper threshold described a speculative excess that the market has not reproduced at the same scale. This is also why pairing on-chain data with the discipline described in our guide to exit liquidity matters more than any single number.
Is a negative MVRV Z-score a buy signal?
It has been a good zone to accumulate, not a signal that the bottom is in. Since 2012 the score has dropped below zero in five separate spells. A year after the first day of each, Bitcoin was higher four times, and in the fifth, October 2014, it fell another 27% before the January 2015 low.
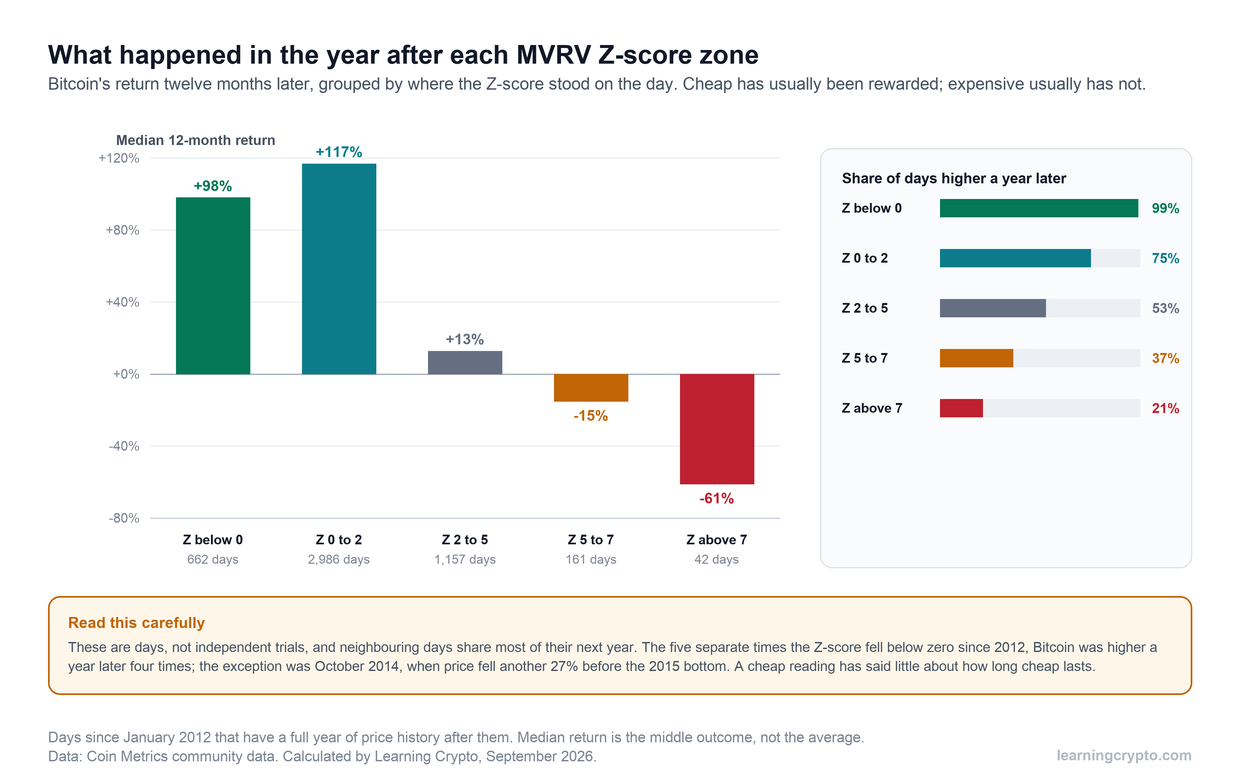
Low readings have usually been followed by a good year and high readings by a bad one. The caution in the panel matters: these are overlapping days rather than separate events, and there have only been five distinct spells below zero.
Two things are true at once in that chart. The pattern is strong: days with a Z-score below zero were followed by a higher price a year later 99% of the time, and days above 7 only 21% of the time. And the sample is thin: those percentages come from overlapping days within a handful of episodes, so they overstate how many independent tests the rule has passed. Treat the zones as a description of where value has been, not as a trigger.
The way experienced accumulators have used it is to buy steadily while the score is low rather than to wait for the exact bottom. That is dollar-cost averaging with larger purchases when value is low, and it is a very different habit from trying to call the low.
How do you read the MVRV Z-score today?
As a map of where the market sits between cost and excess, rather than as a countdown. In mid-September 2026 the score was 0.75. That places Bitcoin in the lower part of the range it has spent most of its history in: above the discount zone, well below anything that has looked stretched in the past, and after a cycle whose peak barely reached 3.4.
- Check the level against this cycle, not 2017. With peaks shrinking, a reading of 3 now carries the weight that 7 once did.
- Watch the direction over weeks. A score rising from below 1 describes a market recovering its cost basis. A score falling from its peak while price holds describes profit being taken quietly.
- Confirm with something that is not on-chain. Momentum and sentiment disagree with valuation often enough to be worth checking. The other four guides in this series cover the ones we use.
- Use it for sizing, not for timing. Low readings argue for buying more of your planned amount. They do not tell you the week.
If you want a structured way to work through any valuation claim, our guide on doing your own research sets out the questions to ask before acting on a chart.
How does the Satoshi Indicator use the MVRV Z-score?
As one input of five, carrying 25% of the weight. The daily Z-score is smoothed with a 14-day moving average, scaled to 0 to 100 against its own history, and blended with the Pi Cycle ratio, the weekly RSI, the Fear and Greed Index and ETF flows. The blend is smoothed again and mapped to a temperature from Deep Value to Overheated, which sets a buying multiplier for a cycle-aware DCA plan.
Using the Z-score as a continuous input rather than as a pair of thresholds is deliberate. It means a shrinking peak still registers as warm, even when it never reaches the old top zone, and the other four inputs can outvote it when valuation and behaviour disagree. The full method, including its limits, is on the Satoshi Indicator page, and the live daily reading is part of the Navigator plan. More guides like this one are in our Analysis hub.
Frequently asked questions
What is a good MVRV Z-score to buy Bitcoin?
Historically, readings below zero have marked the best accumulation zones, and Bitcoin was higher a year later after four of the five separate spells below zero since 2012. Readings between 0 and 2 have also been followed by strong years more often than not. No level marks the exact bottom, and in the 2026 decline the score never went below zero at all.
What does an MVRV Z-score above 7 mean?
It means Bitcoin's market value was more than seven standard deviations above what holders had paid, a level reached near the 2013, 2017 and early 2021 tops. It has not been reached since February 2021. The November 2021 top came at about 3.5 and the October 2025 top at about 2.5, so waiting for 7 would have missed both.
What is the difference between MVRV and the MVRV Z-score?
MVRV is a simple ratio: market cap divided by realized cap, so 1.43 means the market is worth 43% more than holders paid. The Z-score takes the difference between the two instead and divides it by the standard deviation of market cap, which adjusts for how volatile Bitcoin has been and makes readings from different eras easier to compare.
Why do different websites show different MVRV Z-scores?
Providers calculate realized cap from slightly different data and handle details such as lost or unmoved coins differently. Some also use a different window for the standard deviation. The resulting histories have the same shape and turning points, but individual peaks can differ by a point or more, so compare the pattern rather than the decimal.
Is the MVRV Z-score still useful?
Yes, with adjusted expectations. Its lower zone has continued to describe good accumulation periods. Its fixed upper threshold has stopped working because each cycle's peak has been lower. Used as a continuous reading alongside other measures, rather than as a pair of alarm lines, it still tells you where the market sits between its cost basis and excess.
What is the MVRV Z-score right now?
On 16 September 2026 our calculation from Coin Metrics data put it at 0.75, with an MVRV ratio of 1.43 and Bitcoin near $76,000. That is low in its historical range, after a cycle that peaked at 3.4 in December 2024. Readings change daily, so check a live source before relying on the number.
This guide is part of stage 7 of 8, reading the market, in the free Learning Crypto curriculum. Next: The Pi Cycle Top Indicator: How It Works, What It Caught and What It Missed.
Keep learning
- The Pi Cycle Top Indicator: How It Works, What It Caught and What It Missed
- Bitcoin Weekly RSI: What It Shows About Cycle Tops and Bottoms
- Crypto Fear and Greed Index: What It Measures and What Its Record Shows
- Bitcoin ETF Flows Explained: What the Daily Numbers Mean for Price
- On-Chain Analysis: Reading Blockchain Data to Understand Markets
- How the Satoshi Indicator combines all five
- More guides in the Analysis hub