
Few numbers in crypto are quoted more often than the Fear and Greed Index, usually alongside the advice to be greedy when others are fearful. This guide explains what the index actually measures, what it has read since 2018, and what happened to Bitcoin after each kind of reading. The answer to the obvious question, whether extreme fear is a buy signal, is less comfortable than the slogan suggests.
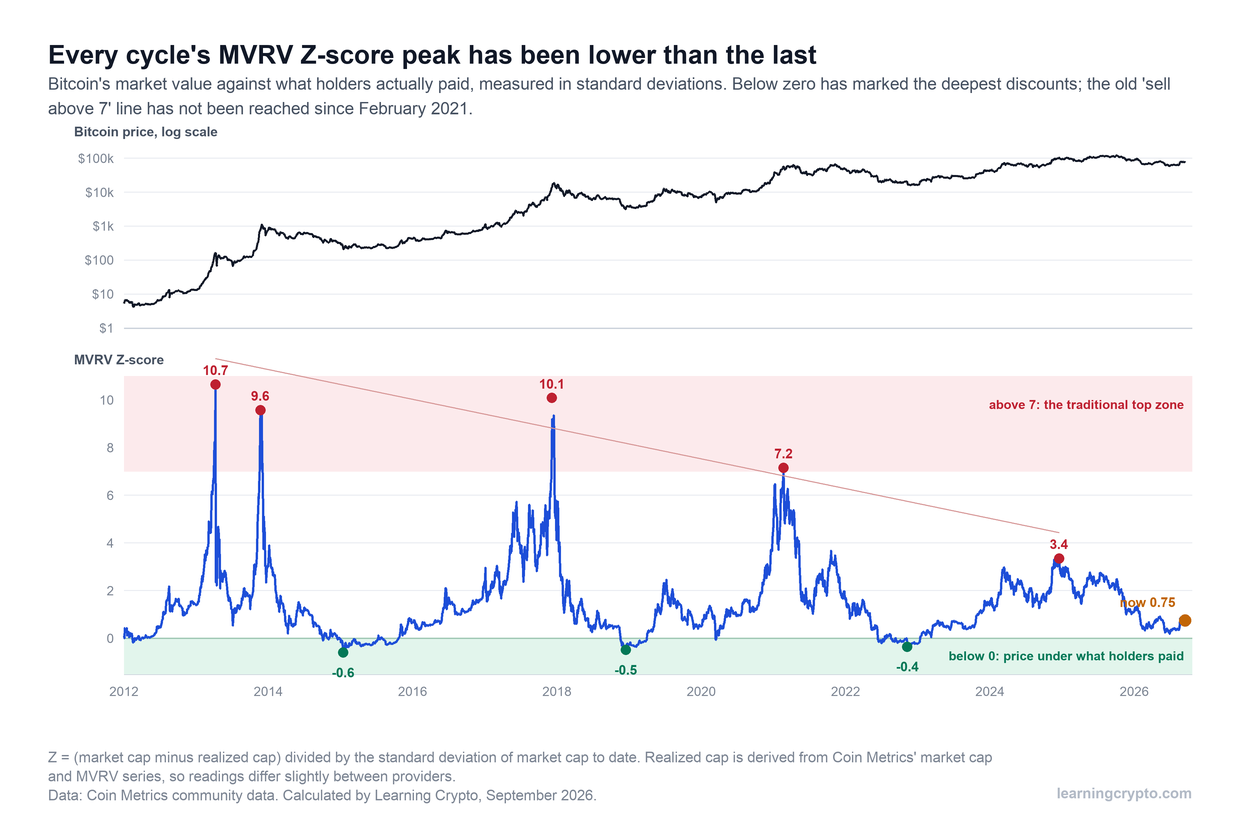
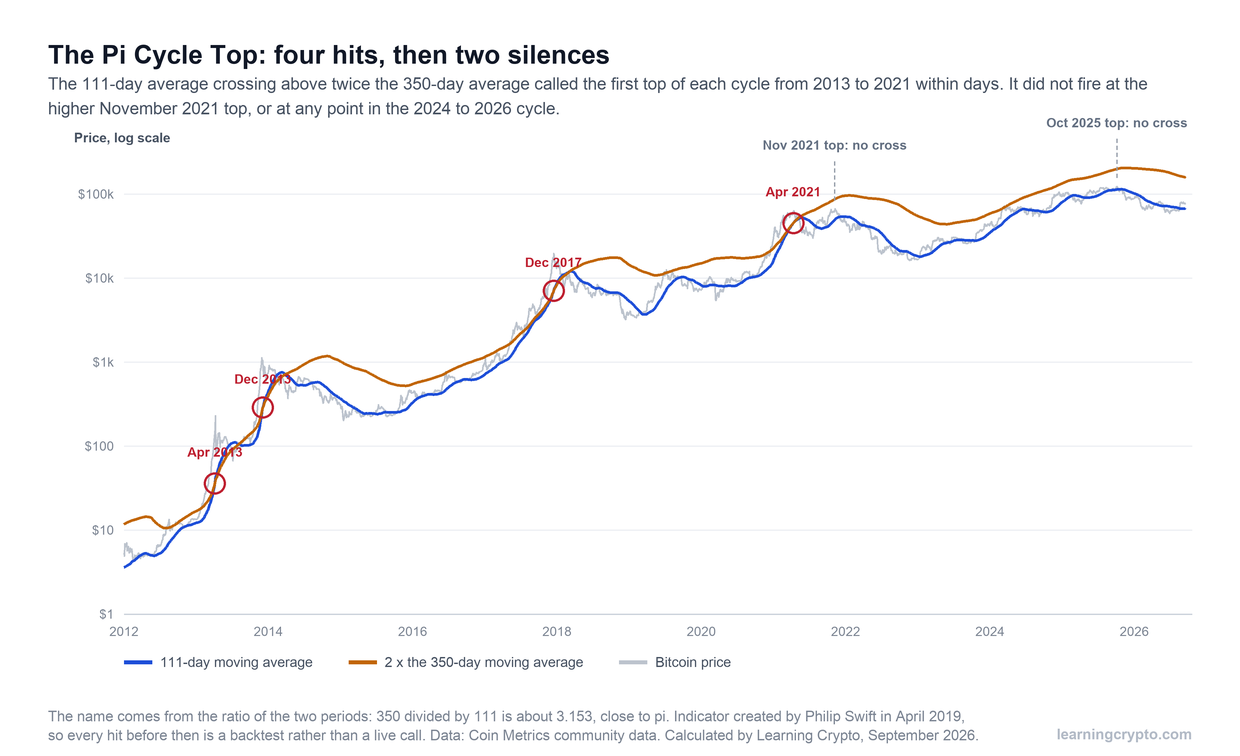
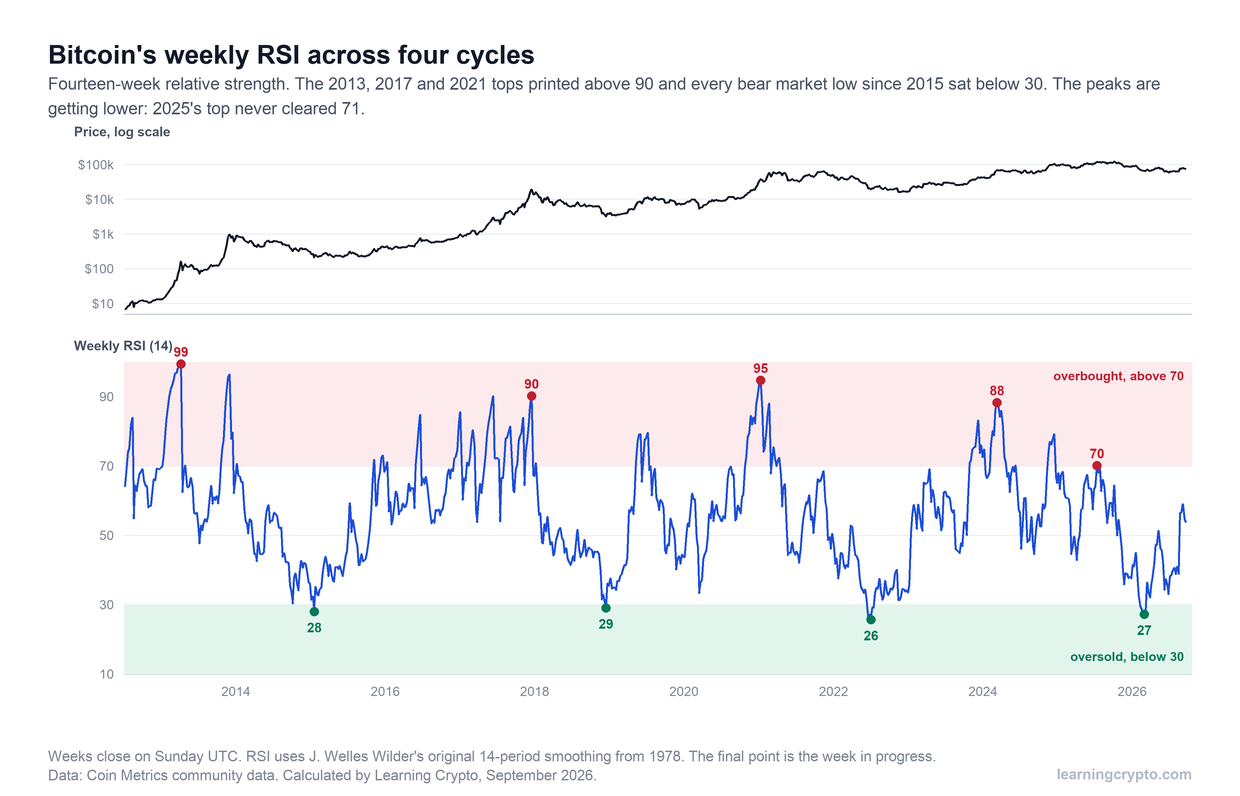
Five inputs sit behind the Satoshi Indicator, and this guide covers one of them. The others are the MVRV Z-score, the Pi Cycle Top, Bitcoin's weekly RSI and ETF flow data.
This is education, not financial advice. The history below describes what happened, not what will happen, and every indicator here has been wrong at least once. Figures were calculated by Learning Crypto from public data in September 2026.
What is the Crypto Fear and Greed Index?
It is a daily score from 0 to 100 that summarises crypto market sentiment, where 0 is maximum fear and 100 maximum greed. The version most people mean is published by Alternative.me, which has produced a reading every day since 1 February 2018 and makes the full history freely available. It borrows its name and idea from the stock market index published by CNN, which is a separate measure built from equity data.
Several other crypto sentiment indices use the same name with different methods. Readings from different providers on the same day can differ by ten points or more, so always check whose index a quoted number comes from. Everything in this guide refers to Alternative.me's.
How is the Fear and Greed Index calculated?
From a weighted blend of market and attention data, mostly about Bitcoin. Alternative.me publishes the components and their weights.
| Component | Weight | What reads as fear |
|---|---|---|
| Volatility | 25% | Unusual rises in volatility and drawdowns against 30- and 90-day averages |
| Market momentum and volume | 25% | Weak buying volume against recent averages |
| Social media | 15% | Low interaction on Bitcoin-related posts |
| Surveys | 15% | Pessimistic polls; this component has been paused for long periods |
| Bitcoin dominance | 10% | Rising dominance, read as money retreating from riskier coins |
| Search trends | 10% | Search patterns associated with worry about the market |
The bands are Alternative.me's own: extreme fear at 25 or below, fear from 26 to 46, neutral from 47 to 54, greed from 55 to 75 and extreme greed at 76 or above.
Two features of that design explain most of what follows. Half the weight is price behaviour, so the index largely restates what the market has just done: a sharp fall produces fear. And none of the components measures value. The index can tell you people are frightened; it cannot tell you whether they have reason to be.
What has the Fear and Greed Index shown since 2018?
Long, persistent moods rather than quick swings. Extreme fear appeared on 23% of all days, and it came in extended spells that matched the bear markets.
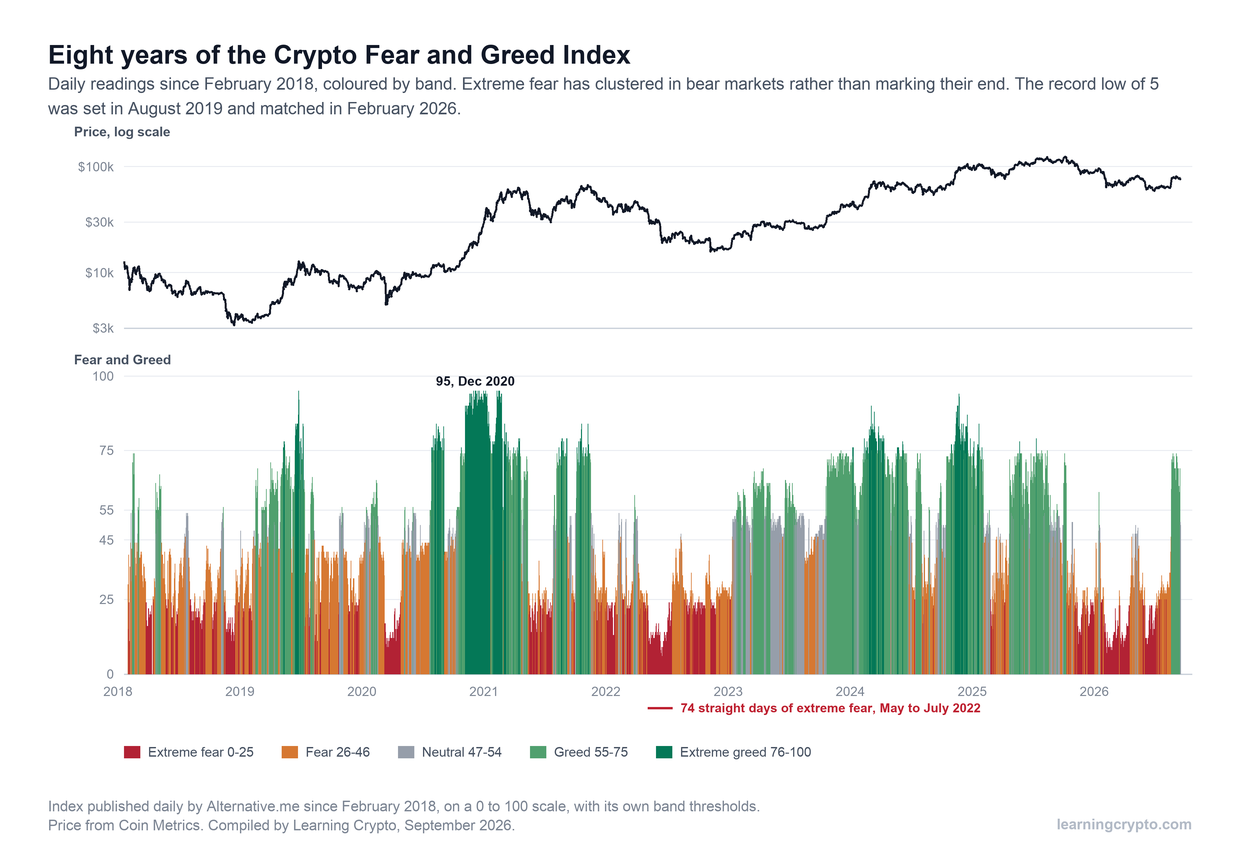
Extreme fear shows up as long red stretches through 2018, 2022 and early 2026, the same periods in which Bitcoin kept falling. The greener stretches cluster in the rallies of 2020 to 2021 and 2024.
- The record low is 5, reached on 22 August 2019 and matched on 12 and 23 February 2026. The index also read 6 on 18 and 19 June 2022.
- The record high is 95, reached in June 2019 and several times between December 2020 and February 2021.
- The longest run of extreme fear lasted 74 days, from 6 May to 18 July 2022, spanning the Terra collapse and the lender failures that followed.
- 2026 has been the most fearful year since 2022. Through mid-September, 53% of days read extreme fear, close to 2022's 57%, and the year's average reading was 28.
The yearly averages trace the cycle clearly: 31 in 2018, 55 in 2021, 25 in 2022, 63 in 2024. The index is an excellent description of how the market felt in any given year. Whether that description can be traded is a different question.
Is extreme fear a good time to buy Bitcoin?
Not on its own, on this record. We took every day since February 2018 and measured Bitcoin's price three, six and twelve months later, grouped by the index band that day.
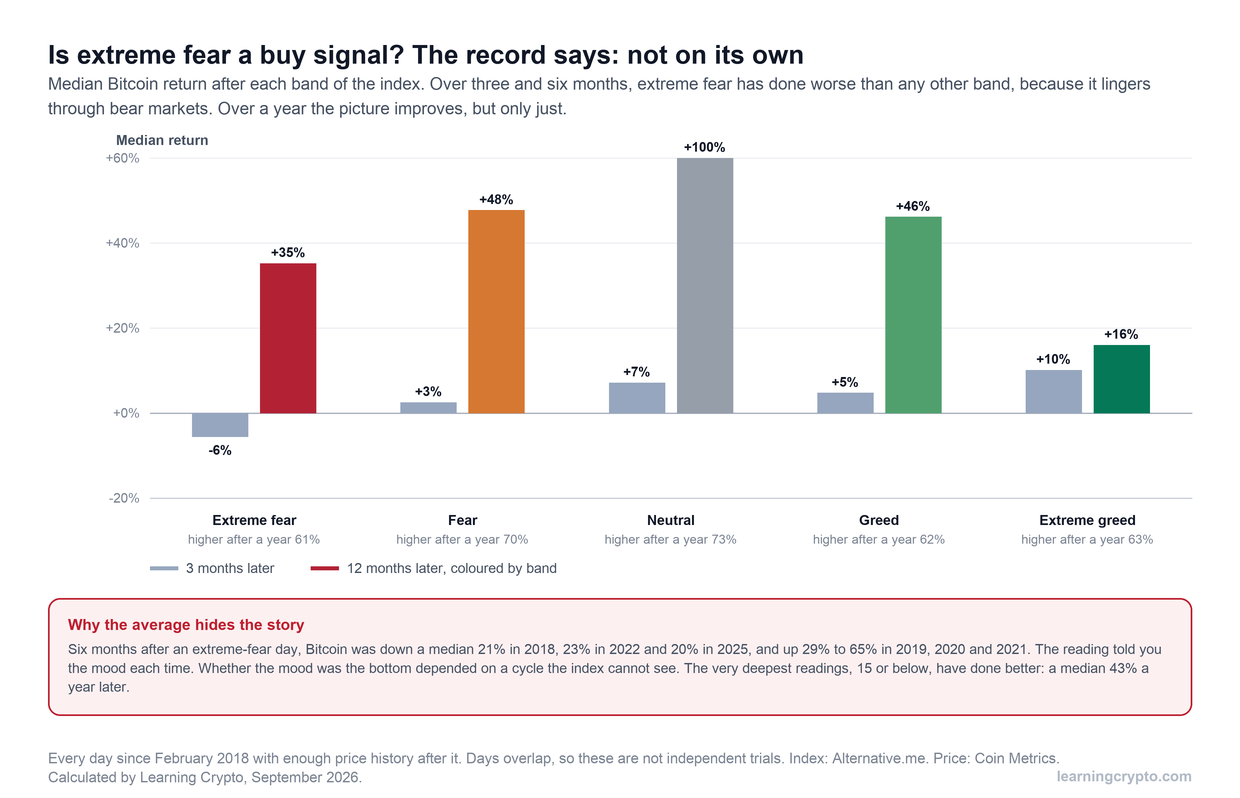
The most repeated rule in crypto, buy when others are fearful, has not worked cleanly on this index. Extreme fear has had the weakest three-month record of any band, because it persists for months in bear markets.
| Band | Share of days | Median after 3 months | Median after 6 months | Median after 12 months | Higher after 12 months |
|---|---|---|---|---|---|
| Extreme fear | 23% | -6% | -6% | +35% | 61% |
| Fear | 29% | +3% | +18% | +48% | 70% |
| Neutral | 13% | +7% | +28% | +100% | 73% |
| Greed | 26% | +5% | +14% | +46% | 62% |
| Extreme greed | 9% | +10% | +9% | +16% | 63% |
Extreme fear had the weakest three- and six-month record of any band. Bitcoin was lower six months later on more than half of extreme-fear days. The reason is visible in the history chart: extreme fear does not arrive at the bottom and leave. It settles in for months while prices keep falling, so most extreme-fear days are somewhere in the middle of a decline.
The year-by-year numbers make that plain. Six months after an extreme-fear day, Bitcoin was down a median 21% in 2018, 23% in 2022 and 20% in 2025, and up between 29% and 65% in 2019, 2020 and 2021. The same reading led to opposite outcomes depending on where the cycle stood, which the index cannot see.
Two refinements do help. The deepest readings, 15 or below, were followed by a median 43% gain a year later. And over twelve months, extreme fear was followed by gains more often than not, 61% of the time. Fear has been a reasonable place to be buying slowly. It has been a poor signal to buy everything at once.
One honesty note on method: neighbouring days share most of their future, so these are not independent trials. There have been only fourteen separate extreme-fear episodes since 2018, and a year after the first day of each, Bitcoin was higher in five of the twelve with data. That is the least flattering view of the same history, and it is worth holding in mind.
Is extreme greed a signal to sell?
Not a reliable one either. Extreme greed was followed by a median 10% gain over three months and was higher a year later 63% of the time. Greed tends to persist through rallies just as fear persists through declines, and the index's highest readings in late 2020 came months before the cycle's price peak. What extreme greed has predicted is weaker returns over the following year than calmer readings, a median of 16% against 46% for ordinary greed. That makes it a reasonable reason to slow buying, not a reason to sell everything.
How should you actually use the Fear and Greed Index?
As a check on your own behaviour, which is where it is most useful. The index measures the crowd's emotion, and your emotion is part of that crowd.
- Notice when your instinct matches the index. If the index reads 10 and you want to sell everything, that is the crowd in you. It is a prompt to check your plan, not to act.
- Buy on a schedule through fear, not in one go. The record above rewards steady buying across a fearful period and punishes guessing the day. That is the case for a written plan such as the one in our guide on how much to invest each month.
- Slow down, rather than stop, in extreme greed. Weaker forward returns are an argument for smaller purchases, not for abandoning a long-term plan.
- Pair it with a valuation measure. Extreme fear with a low MVRV Z-score has been a much stronger combination than extreme fear alone.
- Remember what drives the readings. Large holders moving coins can shift volatility and dominance quickly, as our guide to crypto whales explains, and a cascade of liquidations can drive the index to single digits within a day.
How does the Satoshi Indicator use the Fear and Greed Index?
It carries 15% of the composite, the smallest weight alongside ETF flows, and that is deliberate given the record above. Sentiment is useful as a tiebreaker and a behavioural warning, but it is too persistent to lead. The daily index is smoothed with a 14-day moving average, scaled to 0 to 100, and blended with the MVRV Z-score, the Pi Cycle ratio, weekly RSI and ETF flows.
In practice this means a spell of extreme fear lowers the temperature, and so raises the buying multiplier, only as far as the valuation and momentum inputs agree. The method is documented on the Satoshi Indicator page, the daily reading is part of the Navigator plan, and price data here comes from Coin Metrics. For the thinking behind holding through moods like these, see our long-term strategy guide and the rest of the Analysis hub.
Frequently asked questions
What is the Crypto Fear and Greed Index?
It is a daily 0 to 100 score of crypto market sentiment published by Alternative.me since February 2018. It blends volatility, momentum and volume, social media activity, Bitcoin dominance and search trends, plus a survey component that has often been paused. Readings of 25 or below are extreme fear and 76 or above extreme greed.
Is extreme fear a buy signal for Bitcoin?
Not reliably on its own. Since 2018, Bitcoin was lower six months after more than half of extreme-fear days, with a median change of minus 6%, because fear lasts for months in bear markets. Over twelve months the record is better, and readings of 15 or below did well, which supports buying gradually through fear rather than all at once.
What is the lowest the Fear and Greed Index has been?
The record low is 5, first reached on 22 August 2019 and matched on 12 and 23 February 2026. It read 6 on 18 and 19 June 2022 during the collapse of several crypto lenders. The highest reading is 95, reached in June 2019 and repeatedly between December 2020 and February 2021.
How long can extreme fear last in crypto?
On Alternative.me's index, the longest unbroken run lasted 74 days, from 6 May to 18 July 2022. Extreme fear also dominated long stretches of 2018 and 2026: through mid-September 2026, more than half of that year's days were in extreme fear. Long streaks are typical of bear markets, which is why the reading alone is a poor timing tool.
Is the crypto Fear and Greed Index the same as CNN's?
No. CNN publishes a Fear and Greed Index for the US stock market built from equity measures such as market breadth and options activity. The crypto version from Alternative.me uses crypto market data and attention measures instead. Other crypto sites publish their own indices under the same name, so readings can differ.
What does a neutral Fear and Greed reading mean?
A reading between 47 and 54 means the components are roughly balanced. Historically, neutral days were followed by the strongest twelve-month Bitcoin returns of any band, a median of about 100%, partly because neutral readings often appeared as markets recovered from fear. In mid-September 2026 the index read 50.
This guide is part of stage 7 of 8, reading the market, in the free Learning Crypto curriculum. Next: Bitcoin ETF Flows Explained: What the Daily Numbers Mean for Price.
Keep learning
- MVRV Z-Score Explained: How to Read Bitcoin's Most Watched Valuation Metric
- The Pi Cycle Top Indicator: How It Works, What It Caught and What It Missed
- Bitcoin Weekly RSI: What It Shows About Cycle Tops and Bottoms
- Bitcoin ETF Flows Explained: What the Daily Numbers Mean for Price
- Guide to Long Term Crypto Investment Strategy
- How the Satoshi Indicator combines all five
- More guides in the Analysis hub