
Since January 2024, one table has shaped Bitcoin commentary more than any other: the daily flow figures for US spot Bitcoin ETFs. A big green number is reported as demand, a big red one as a warning. This guide explains what those numbers measure, where the money has actually gone, how to read the table yourself, and what the full record says about whether flows move the price or follow it.
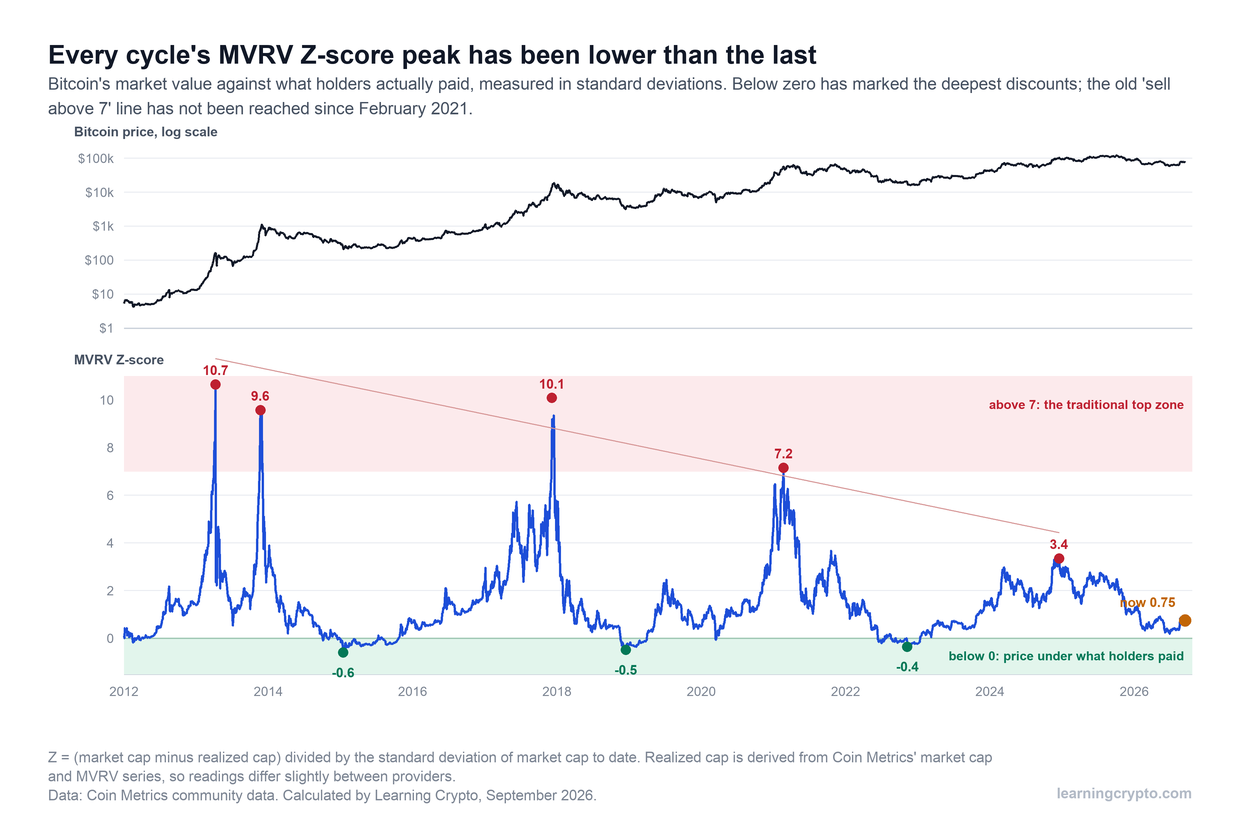
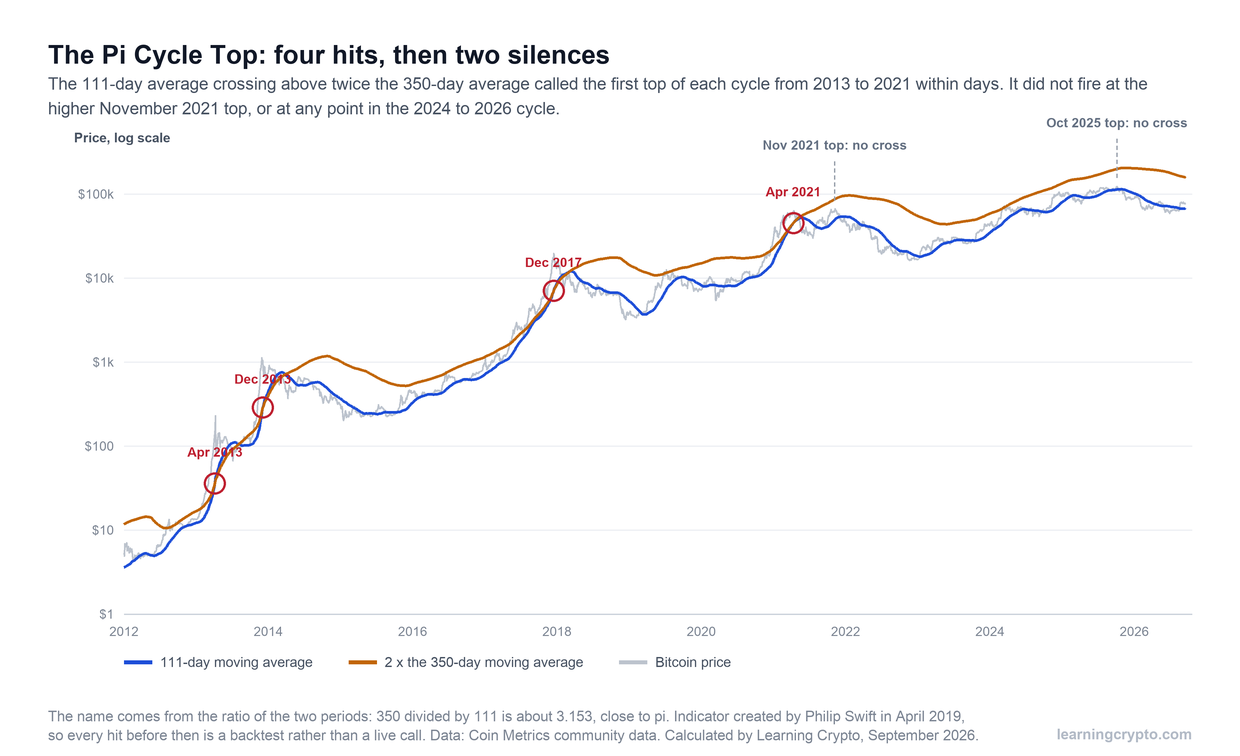
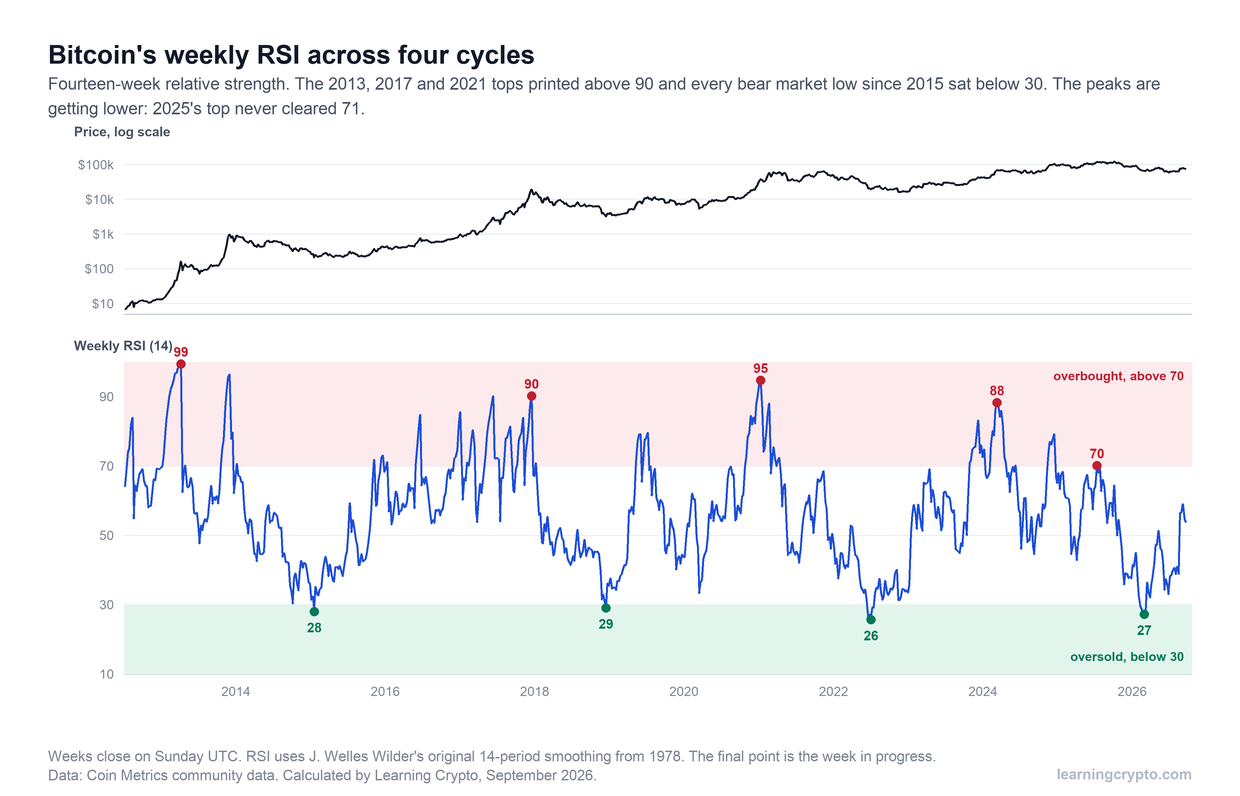
It is the last of five guides to the inputs behind the Satoshi Indicator. The others explain the MVRV Z-score, the Pi Cycle Top indicator, weekly RSI and the Crypto Fear and Greed Index.
This is education, not financial advice. The history below describes what happened, not what will happen, and every indicator here has been wrong at least once. Figures were calculated by Learning Crypto from public data in September 2026.
What are Bitcoin ETF flows?
ETF flows are the dollar value of new fund shares created, minus shares redeemed, on a given trading day. When investors buy more shares of a spot Bitcoin ETF than they sell, the fund issues new shares and buys Bitcoin to back them. That is an inflow. When they redeem shares, the fund sells or releases Bitcoin. That is an outflow.
The distinction that matters is between trading and flows. Most days, shares simply change hands between investors on the exchange, which moves the share price but not the fund's holdings. Flows only happen when large firms called authorised participants create or redeem blocks of shares. A day with huge trading volume can have a flow of zero.
If ETFs themselves are new to you, our guide to crypto ETFs covers how they work and what owning one means compared with holding the coins. The short version is that an ETF holder owns a claim on Bitcoin held by a custodian, not the Bitcoin itself, which is a real difference from self-custody.
How do spot Bitcoin ETFs turn flows into Bitcoin?
Through a creation and redemption process that keeps the share price close to the value of the Bitcoin behind it.
- Demand pushes the share price above the fund's value. More buyers than sellers on the exchange lift the price slightly above the Bitcoin each share represents.
- An authorised participant creates new shares. It delivers cash or Bitcoin to the fund and receives a block of new shares, which it sells into the market, closing the gap.
- The fund's custodian holds the Bitcoin. If the participant delivered cash, the fund buys Bitcoin with it. Either way, the fund's holdings grow.
- Redemptions run the process in reverse. Shares come back, and cash or Bitcoin goes out.
When the funds launched, the SEC required cash creations only. On 29 July 2025 it permitted in-kind creations and redemptions, so participants can now deliver Bitcoin directly. That change affects who buys the Bitcoin and where, not the size of the flow.
How much has flowed into US spot Bitcoin ETFs?
$54.6 billion net across 672 trading days, from the first day of trading on 11 January 2024 to 16 September 2026, according to the daily table published by Farside Investors. The SEC had approved the funds the day before, a decision its chair explained in a public statement. Bitcoin closed at $46,381 on launch day.
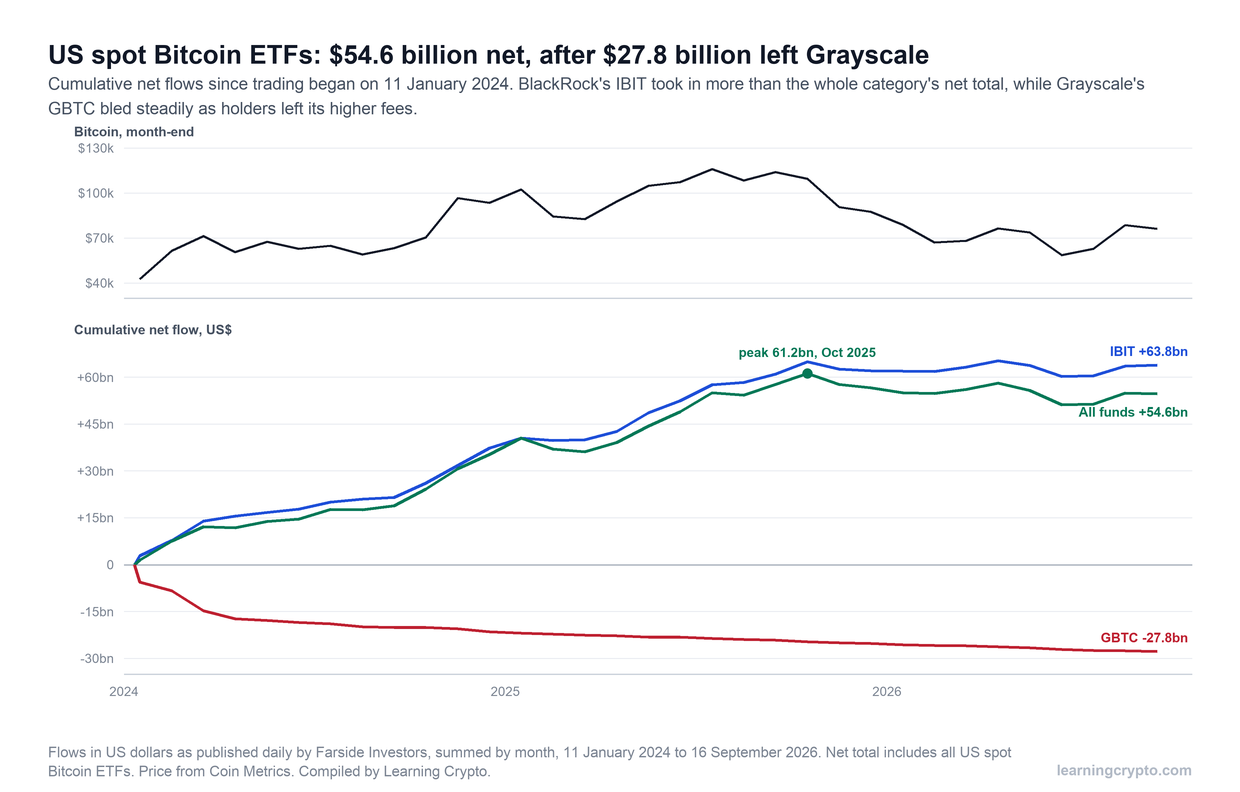
BlackRock's fund alone has taken in more than the whole category's net total, because much of the money arriving elsewhere was money leaving Grayscale's older, more expensive trust.
| Fund | Net flow since launch |
|---|---|
| BlackRock iShares Bitcoin Trust (IBIT) | +$63.8 billion |
| Fidelity Wise Origin Bitcoin Fund (FBTC) | +$10.1 billion |
| Grayscale Bitcoin Mini Trust (BTC) | +$2.9 billion |
| Bitwise Bitcoin ETF (BITB) | +$2.1 billion |
| ARK 21Shares Bitcoin ETF (ARKB) | +$1.1 billion |
| VanEck Bitcoin ETF (HODL) | +$1.0 billion |
| Other funds combined | +$1.4 billion |
| Grayscale Bitcoin Trust (GBTC) | -$27.8 billion |
| All funds, net | +$54.6 billion |
Two things stand out. BlackRock's fund took in more on its own than the whole category did net, and Grayscale's original trust lost more than $27 billion. GBTC was a closed-end trust holding a large amount of Bitcoin before it converted to an ETF, and it charged 1.5% a year, several times what the new funds charged. Much of the money arriving at BlackRock and Fidelity in 2024 was money leaving Grayscale. Cumulative net flows peaked at $61.2 billion in October 2025 and have drifted lower through the 2026 decline.
How do you read the daily ETF flow table?
Farside's table lists each fund in a column and each trading day in a row, in millions of US dollars, with outflows in brackets and a total at the end of each row. Four habits make it far more useful than the headlines built on it.
- Read the total, not the biggest fund. A large IBIT inflow on a day of larger outflows elsewhere is a net outflow day.
- Use a rolling sum. Single days are noisy: 398 of the 672 days were inflows and 274 outflows. A 20-day total smooths that into something readable. It peaked near +$8.9 billion in November 2024 and troughed near -$5.6 billion in June 2026.
- Remember the timing. Flows are reported after the US close and settle a day or more later, so a flow figure describes demand at US market prices, not what Bitcoin did overnight.
- Treat dollars as dollars. The same dollar inflow buys fewer coins when the price is high. Comparing flows across years without adjusting for price exaggerates recent months.
| Largest days | Net flow | Bitcoin that day |
|---|---|---|
| 7 November 2024 | +$1,374 million | $75,972 |
| 6 October 2025 | +$1,205 million | $124,824 |
| 10 July 2025 | +$1,176 million | $115,874 |
| 25 February 2025 | -$1,114 million | $88,770 |
| 20 November 2025 | -$903 million | $86,911 |
| 13 November 2025 | -$867 million | $100,035 |
Do ETF flows move the Bitcoin price?
They move with it. On the record so far, they have not moved ahead of it.
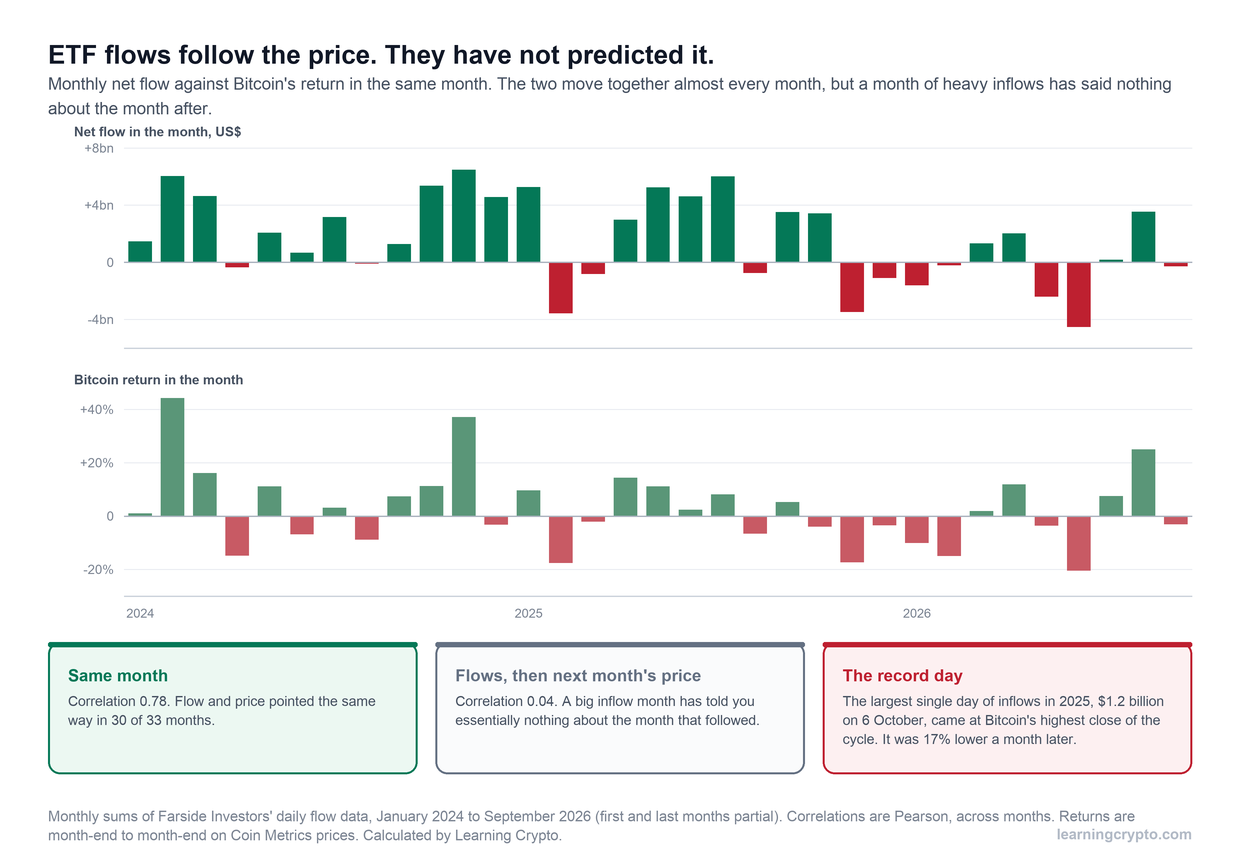
The bars line up month by month, which is why flows feel predictive. They are not: a strong inflow month has told you almost nothing about the month that followed.
Across 33 months, the net flow in a month and Bitcoin's return in the same month had a correlation of 0.78, and pointed the same way in 30 of those months. That is a strong relationship, and it is why flows are so often reported as the cause of each move. But the flow in one month and Bitcoin's return in the next had a correlation of 0.04, which is no relationship at all. And the return in one month and the flow in the next had a correlation of 0.27, a weak but real sign that money arrives after prices have already risen.
The largest inflow day of 2025 is the sharpest illustration. On 6 October, $1.2 billion arrived on the same day Bitcoin made the highest close of its cycle. A month later the price was 17% lower. The flow was real demand, and it described the top rather than predicting more upside. The record day overall, 7 November 2024, came two days after the US election and was followed by a 32% gain over the next month. Same signal, opposite outcomes.
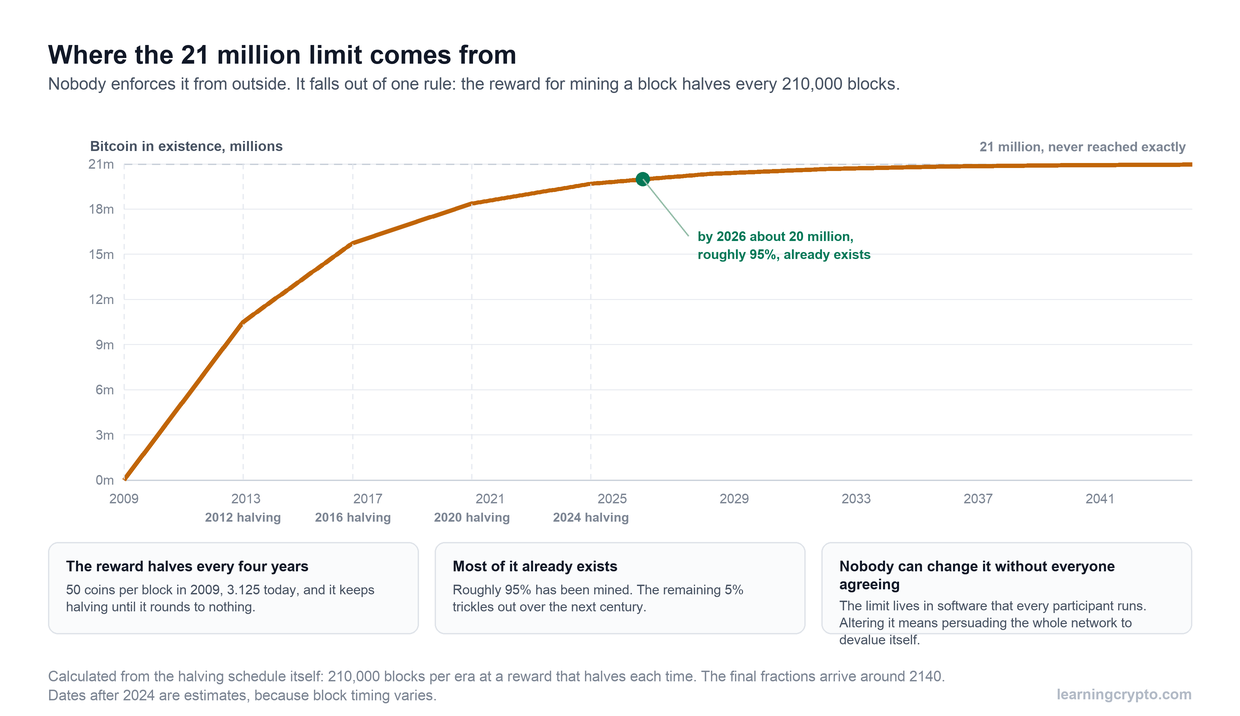
This does not make flows useless. Sustained inflows over months mean a large, persistent buyer is absorbing supply, which matters for a market with a fixed issuance schedule, as our guide to what Bitcoin is explains. Sustained outflows mean that buyer has stepped back. What the data does not support is reading a single day, or even a single month, as a forecast.
Why do ETF flows matter for long-term holders?
Because they reveal who is buying. Before 2024, most Bitcoin demand came from individuals, exchanges and a few companies, and it was hard to measure. The ETF table is a daily, public record of one large group of buyers: advisers, pension allocators, and investors who want Bitcoin exposure through a brokerage account. That group behaves differently from crypto-native holders. It adds steadily in rising markets and trims in falling ones, which is part of why this cycle has been longer and smoother than the last three, a change also visible in the MVRV Z-score.
It also changes the argument about Bitcoin as a store of value. Gold's large ETFs became a standard way for institutions to own the metal. Whether Bitcoin's follow the same path is the question the flow table answers one day at a time. For the on-chain side of the same picture, see our on-chain analysis guide.
How does the Satoshi Indicator use ETF flows?
As 15% of the composite, from 1 January 2024 onward. Before that date the input does not exist, and the other four inputs are reweighted to fill its place. The daily flow series is smoothed with a 14-day moving average, scaled to 0 to 100 against its own short history, and blended with the MVRV Z-score, Pi Cycle ratio, weekly RSI and Fear and Greed Index.
Its modest weight reflects the evidence above. Flows are a good description of current institutional demand and a poor forecaster, so they refine the temperature reading rather than drive it. The method is set out in full on the Satoshi Indicator page, and the live reading is part of the Navigator plan. Our Analysis hub collects the rest of this series.
Frequently asked questions
What are Bitcoin ETF inflows and outflows?
An inflow is the dollar value of new ETF shares created on a day, which the fund backs by acquiring Bitcoin. An outflow is the value of shares redeemed, which reduces the fund's Bitcoin. Ordinary trading between investors does not count. Daily net flows across all US spot Bitcoin ETFs are published by several trackers, including Farside Investors.
How much money has gone into Bitcoin ETFs?
US spot Bitcoin ETFs took in $54.6 billion net between 11 January 2024 and 16 September 2026, according to Farside Investors. BlackRock's IBIT took in $63.8 billion and Fidelity's FBTC $10.1 billion, while Grayscale's GBTC lost $27.8 billion as holders left its higher-fee trust. Cumulative net flows peaked at $61.2 billion in October 2025.
Do ETF inflows push the Bitcoin price up?
Flows and price have moved together closely: monthly flows and same-month returns had a correlation of 0.78 from 2024 to 2026. But flows in one month had almost no relationship with the next month's return, a correlation of 0.04, and some evidence suggests money follows price. Flows describe demand as it happens rather than forecasting it.
Why did Grayscale's GBTC have such large outflows?
GBTC existed as a closed-end trust with large Bitcoin holdings before converting to an ETF in January 2024, and it kept a 1.5% annual fee, several times what the new funds charged. Many holders could finally exit at the value of the Bitcoin, and much of that money moved to cheaper funds. Its net outflow reached $27.8 billion by September 2026.
What was the biggest day for Bitcoin ETF flows?
The largest net inflow was $1.37 billion on 7 November 2024, two days after the US election. The largest net outflow was $1.11 billion on 25 February 2025. The largest inflow of 2025, $1.2 billion on 6 October, arrived on the day of Bitcoin's highest close of the cycle, and the price was 17% lower a month later.
Where can I check daily Bitcoin ETF flows?
Farside Investors publishes a free daily table of US spot Bitcoin ETF flows by fund, in millions of dollars, with outflows shown in brackets. Several data providers and news sites republish the same figures. Read the total rather than any single fund, and use a rolling multi-week sum to see the trend.
This guide is part of stage 7 of 8, reading the market, in the free Learning Crypto curriculum. Next: A long-term crypto strategy.
Keep learning
- MVRV Z-Score Explained: How to Read Bitcoin's Most Watched Valuation Metric
- The Pi Cycle Top Indicator: How It Works, What It Caught and What It Missed
- Bitcoin Weekly RSI: What It Shows About Cycle Tops and Bottoms
- Crypto Fear and Greed Index: What It Measures and What Its Record Shows
- Crypto ETFs Explained: What Are They and How Do They Work?
- How the Satoshi Indicator combines all five
- More guides in the Analysis hub