What Is a Crypto Bull Run and When Is the Next One Coming?
 by Heidi Chakos
TL; DR A crypto bull run is a sustained period of rising cryptocurrency prices, driven by growing demand, positive market sentiment, and increased capital inflows. Bull runs often follow major catalysts like Bitcoin halvings, looser financial conditions, or renewed investor confidence, but their exact timing is impossible to predict with certainty.
What exactly qualifies as a bull run, and when can we expect the next one?
The first question has a solid answer backed by market behavior and historical data.
The second? Well, that's where things get a lot more speculative. While we can define a bull run with reasonable precision, predicting when the crypto market will catch fire again involves a dizzying array of variables. No single indicator tells the whole story.
We’ll tackle both sides. First, we’ll clearly define what a crypto bull run looks like and how it behaves. Then we’ll shift to the harder part-examining the signals, cycles, and conditions that typically precede the next one, without pretending anyone can time it perfectly.
What You'll Learn in This Guide
➤ What actually qualifies as a bull run. Not just "prices go up," but the specific characteristics that separate genuine bull markets from temporary rallies and bear market traps
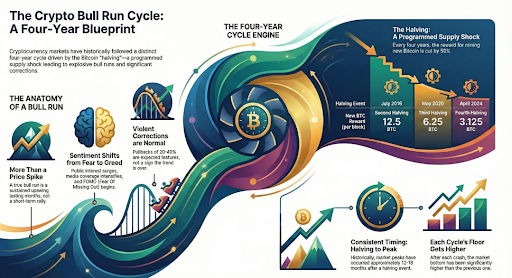
➤ Why Bitcoin moves in four-year cycles.The hardcoded halving mechanism that's driven every major price explosion, and why this mathematical certainty matters more than hype
➤ The complete history of all three bull runs. What happened in 2013, 2017, and 2021, including the crashes everyone wants to forget and the lessons that separate winners from losers
➤ When the next bull run is coming. Multiple timeline scenarios based on whether October 2025 was the peak or just a correction, plus the one certainty no one can argue with
➤ How to position yourself. Practical strategies for accumulation, risk management, and avoiding the mistakes that wipe out retail investors every single cycle
What Is a Crypto Bull Run?
A crypto bull run isn't just "prices going up." It's a specific type of market behavior with identifiable characteristics that distinguish genuine bull markets from temporary price spikes or bear-market rallies.
Understanding the difference matters because misreading the market phase leads to costly mistakes - buying at tops, selling bottoms, or over-leveraging at the wrong time.
Not Just Simple Price Increases
At its core, a bull run is a sustained period of rising cryptocurrency prices driven by growing demand, positive market sentiment, and increased capital inflows. But "sustained" is the key word here. We're talking months, not days or weeks.
A real bull run shows accelerating momentum. Prices don't climb steadily; rather, they move in explosive bursts. Bitcoin went from $16,000 in November 2022 to $126,000 in October 2025, but most of those gains were concentrated in specific explosive periods, not gradual daily increases.
The psychology shifts dramatically. Markets transition from fear and skepticism to optimism and eventually greed. Early in a bull run, people are cautious, remembering previous crashes. As it progresses, FOMO takes over. By the peak, even skeptics who swore they'd never touch crypto are asking how to buy Bitcoin.
The Typical Characteristics
Duration: Measured in Months, Not Days
Real bull runs last for many months to over a year. The 2020-2021 cycle ran approximately 18 months from the May 2020 halving to the November 2021 peak. Short-term rallies-even dramatic ones don't qualify.
Crypto can pump 30% in a week and still be deep in a bear market. Those are volatility spikes, not trend reversals.
Breadth: The Whole Market Participates
It's not just Bitcoin. True bull runs eventually pull the entire cryptocurrency market higher. Bitcoin typically leads, establishing new all-time highs first. Then Ethereum and major altcoins follow. Eventually, even smaller altcoins surge in what's commonly called "altcoin season."
This broad participation distinguishes bull runs from isolated rallies where one or two assets pump while the rest of the market stays flat or declines.
Volume: Trading Activity Surges
Bull runs bring sustained increases in trading volume, not just price spikes on thin volume. More participants enter the market. Exchange activity accelerates. Network transaction volumes increase. This reflects genuine demand growth, not manipulation or wash trading.
When prices rise on declining volume, that's typically a warning sign of weakness. Sustainable bull runs need fuel; by this, we mean actual buying pressure from real capital entering the market.
Sentiment Shift: From Fear to Greed
Market sentiment undergoes a complete transformation during bull runs. The Fear & Greed Index, Google search trends for "Bitcoin," new wallet creation rates, and social media activity all spike dramatically.
People who ignored crypto for years suddenly can't stop talking about it. Your relatives ask about Bitcoin at family gatherings. Mainstream media runs daily coverage. "Bitcoin hits new record" becomes regular news instead of shocking headlines.
This sentiment shift is both a driver and a signal of bull runs, and it's also what makes tops so hard to identify, because maximum optimism often precedes major corrections.
New Highs: Breaking Previous Cycle Peaks
Legitimate bull runs push Bitcoin and major cryptocurrencies above previous all-time highs, not just recovering from recent lows.
Bear market rallies might recover 50-100% from local bottoms but fail to reclaim previous highs. Bull runs establish entirely new price ranges and market structures.
Capital Inflows: Fresh Money Enters
Bull runs require sustained capital inflows from both retail and institutional sources. The 2020-21 cycle saw companies like MicroStrategy and Tesla add Bitcoin to their balance sheets.
Without fresh capital, just existing holders trading among themselves, prices lack the fuel needed for sustained rallies.
On-Chain Activity: Network Usage Increases
Blockchain metrics tell part of the story. During bull runs:
Transaction volumes increase significantly
Active addresses grow as new participants enter
Exchange inflows and outflows show accumulation patterns
Whale wallets (large holders) become more active after dormancy
Gas fees often increase due to network congestion from high activity
These on-chain signals provide objective data about market participation beyond just price charts.
Pullbacks Get Bought: Corrections Trigger Buying
Perhaps the clearest bull run characteristic: corrections don't trigger panic selling- they trigger buying. When Bitcoin drops 20-30% during a bull run, investors view it as a discount opportunity rather than a signal to exit.
"Buy the dip" actually works during bull runs because the underlying trend remains bullish. In bear markets, the same-sized drops trigger further panic and lower prices.
Altcoin Season Follows
As Bitcoin dominance (Bitcoin's share of total crypto market cap) peaks, capital rotates into Ethereum and altcoins. Traders take Bitcoin profits and chase higher-percentage gains in smaller assets.
This rotation is characteristic of mature bull runs. New projects launch rapidly. ICOs, token sales, or whatever the current funding mechanism becomes, see explosive activity. This phase is both exciting and dangerous. Altcoin gains can be massive, but most projects ultimately fail.
What a Bull Run Is NOT
Clearing up common misconceptions matters because mistakes in this area cost people serious money.
Not a Single Day, Week, or Month of Gains
That's just volatility. Crypto is inherently volatile. A 30% pump in a week looks impressive but means nothing for the broader trend. Bitcoin has experienced numerous 20-40% rallies during brutal bear markets, only to crash to new lows shortly after.
These head-fakes trap inexperienced traders constantly. Random price spikes triggered by isolated news events, short squeezes, or temporary liquidity imbalances don't indicate trend reversals.
Not a Bear Market Rally
These are particularly dangerous because they look like bull runs in their early stages. Prices rise sharply, sentiment briefly improves, and hope returns to the market. Then the rally fails, and the downtrend resumes viciously.
The 2022 rallies from $20,000 to $25,000 looked promising until Bitcoin dropped back below $16,000. Bear market rallies sucker in late sellers who've capitulated and eager buyers who think the bottom is in—then they reverse, inflicting maximum pain.
The big difference: bear market rallies occur within a larger downtrend structure. They fail to break through major resistance levels or establish a new market structure. They're counter-trend moves, not trend reversals.
Not Guaranteed to Last a Specific Duration
No bull run comes with a schedule. They end when they end, often when optimism reaches maximum levels, and everyone expects higher prices. Past cycles provide context but don't dictate future duration.
The market doesn't owe anyone a year-long rally or a specific price target. Assuming "bull runs always last 18 months" or "Bitcoin always hits [X price]" is dangerous. Markets are probabilistic, not deterministic.
Not a Time When "Everyone Makes Money"
This is perhaps the most damaging myth. Even during the most explosive bull runs, a large portion of retail investors lose money by:
Buying near tops after FOMO kicks in (usually after the easy gains are gone)
Selling during normal corrections out of fear
Over-leveraging and getting liquidated on routine pullbacks
Chasing low-cap altcoins that pump then dump
Trading frequently and accumulating losses from fees and bad timing
Winners in bull runs are typically early accumulators who bought during the fear and uncertainty of bear markets, not those who arrive after prices have already doubled or tripled. Patience and conviction matter more than timing perfection.
Not a Straight Line Up
Bull runs include regular, often violent corrections. Pullbacks of 20-40% are completely normal and healthy within larger uptrends. These shakeouts serve important functions:
Clear out over-leveraged positions
Reset sentiment (reducing excessive optimism)
Allow new buyers to enter at better prices
Establish support levels for the next leg up
The 2017 bull run included numerous 30%+ corrections before the final peak. The 2021 cycle had a brutal summer correction from $64,000 to $29,000 before Bitcoin eventually pushed to $69,000 in November.
Expecting smooth sailing leads to panic during normal volatility. Understanding that corrections are features, not bugs, helps maintain conviction during temporary drawdowns.
The Four-Year Cycle Explained
Why Crypto Moves in Cycles
Unlike stocks, Bitcoin has a built-in mechanism creating predictable supply shocks every four years that’s hardcoded into the protocol itself.
This isn't market psychology or technical analysis. It's mathematics and immutable code. Every approximately four years, Bitcoin's new supply gets cut in half. This programmed scarcity event has driven every major bull run in cryptocurrency history.
It's the closest thing crypto has to a predictable catalyst. Markets are chaotic and unpredictable, but the halving happens like clockwork after a certain number of blocks are mined.
The Bitcoin Halving Mechanics
Every 210,000 blocks (roughly every 4 years), Bitcoin's protocol automatically cuts mining rewards by 50%. Miners validate transactions and secure the network, receiving newly created Bitcoin as payment. The halving slashes this payment, reducing the rate of new Bitcoin entering circulation.
Here's how Bitcoin's supply schedule has evolved:
➤ 2009-2012: 50 BTC per block
New Bitcoin created: ~2,625,000 BTC per year
➤ 2012-2016: 25 BTC per block (first halving - November 2012)
New Bitcoin created: ~1,312,500 BTC per year
➤ 2016-2020: 12.5 BTC per block (second halving - July 2016)
New Bitcoin created: ~656,250 BTC per year
➤ 2020-2024: 6.25 BTC per block (third halving - May 2020)
New Bitcoin created: ~328,125 BTC per year
➤ 2024-2028: 3.125 BTC per block (fourth halving - April 2024)
New Bitcoin created: ~164,063 BTC per year
➤ 2028-2032: 1.5625 BTC per block (fifth halving - projected March/April 2028)
New Bitcoin created: ~82,031 BTC per year
This continues until approximately 2140, when all 21 million Bitcoin will have been mined.
Read all about ‘What Happens When All the Bitcoin is Mined’
Why This Creates Bull Runs
The economics are straightforward: new supply gets cut 50% overnight while demand either stays constant or grows. Basic supply and demand dictates that prices must rise.
Think of oil production suddenly being cut 50% globally. Even with completely flat demand, prices would surge dramatically. Producers couldn't maintain previous supply levels. Buyers would compete for reduced inventory. Prices would spike until demand destruction brought things back into balance or new supply came online.
With Bitcoin, the new supply can't suddenly increase as it's capped by the protocol. And demand typically doesn't just stay flat during halving periods. It increases, often substantially.
Why does demand increase? Several reinforcing factors:
Media attention accelerates. News outlets cover the halving event itself, introducing Bitcoin to new audiences. As prices begin rising post-halving, coverage intensifies. Headlines about "Bitcoin hits new all-time high" bring waves of new interest.
FOMO kicks in. People who ignored Bitcoin during the bear market suddenly can't ignore it when friends, family, and coworkers won't stop talking about their gains. Fear of missing out drives enormous retail demand.
Institutional interest grows. Professional investors watching the supply dynamics recognize the opportunity. Corporate treasuries explore Bitcoin allocation. Investment products launch or see increased inflows.
Speculative feedback loops amplify moves. Rising prices attract more buyers. More buyers push prices higher. Higher prices generate more media coverage. More coverage brings more buyers. These reflexive dynamics turn supply shocks into full bull markets.
The combination of mathematically guaranteed supply reduction and typically increasing demand creates the explosive price action that defines crypto bull runs.
The Typical Cycle Pattern
Based on three complete cycles (2012-2024), a relatively consistent pattern has emerged. While each cycle has unique characteristics, the general rhythm repeats:
Post-Halving Accumulation: Prices consolidate. Long-term investors accumulate quietly. Media interest fades. Retail participation is minimal.
Bull Run Acceleration: Prices break previous highs. Momentum builds. Coverage intensifies. New participants rush in. Gains compress into short, aggressive moves.
Blow-Off Top & Crash: Euphoria peaks. Leverage builds. Expectations detach from reality. A sharp reversal follows, often wiping out 70–85% from peak to trough.
Bear Market / Crypto Winter: Long consolidation. Prices stabilize at higher levels than in the prior cycle. Sentiment remains negative. Most retail exits.
Then the next halving approaches, and the process begins again.
Important Caveats
Before treating this pattern as gospel, critical limitations need acknowledgment:
Sample size is tiny. We've only seen 3-4 complete halving cycles. In statistical terms, this is a drop in the ocean. Drawing definitive conclusions from such limited data is dangerous. The pattern could break at any time.
Each cycle has been different. The 2013 cycle had a double-top structure. The 2017 cycle was driven by ICO mania. The 2021 cycle featured institutional adoption and COVID stimulus. The catalysts, narratives, and specific price action vary significantly even while the general rhythm remains similar.
Percentage gains diminish each cycle. This is the law of large numbers. The first cycle saw 10,000%+ gains from early 2012 lows to the 2013 peak. The second cycle saw roughly 3,000% gains. The third cycle saw roughly 1,400% gains. Each successive cycle produces smaller percentage returns because Bitcoin's market cap grows larger.
As Bitcoin matures, explosive percentage gains become mathematically impossible.
The pattern could break as markets mature. Every cycle, people claim "this time is different." Usually, they're wrong. The halving cycle has held remarkably well. But eventually, they'll be right.
As Bitcoin becomes a multi-trillion-dollar asset held by institutions, sovereign nations, and retirement funds, the wild volatility and 70-80% drawdowns may moderate. The cycle might elongate, smooth out, or become unrecognizable. A $10 trillion Bitcoin behaves differently from a $100 billion Bitcoin.
Past performance doesn't guarantee future results. The mandatory disclaimer here. Just because the halving drove three previous bull runs doesn't mean it will drive the next one. Black swan events, regulatory crackdowns, superior competing technology, macroeconomic crises, and any number of other factors could override the halving's supply dynamics.
Use the cycle as context, not prophecy.
Historical Bull Runs: A Complete Timeline
Crypto bull runs don’t all look the same, but they rhyme. Each cycle has been driven by a different narrative, a different group of participants, and a different macro backdrop. What’s consistent is the structure: a halving-driven supply shock, followed by expanding demand, followed by excess.
Here’s how each major cycle actually played out.
First Bull Run (2011-2013)
Halving: November 2012 (50 → 25 BTC) | Peak: December 2013, ~$1,100 | Gain: 10,000%+
This cycle proved the halving theory worked. The 2011 bear market saw Bitcoin crash 93% from $30 to $2. "Bitcoin is dead" dominated the narrative.
The November 2012 halving passed quietly. Prices ground higher through 2013. The Cyprus banking crisis in March highlighted Bitcoin's censorship resistance. The rally accelerated. Bitcoin hit $100, then $200, then $1,100 by late November before crashing.
The Crash: 80%+ decline to ~$200 by early 2015. Mt. Gox collapsed in February 2014, wiping out billions.
Lesson: Halvings create real supply shocks. Bull runs attract mainstream attention, then crash viciously.
Second Bull Run (2015-2017)
Halving: July 2016 (25 → 12.5 BTC) | Peak: December 2017, ~$20,000 | Gain: ~3,000%
The ICO boom defined this cycle. Ethereum launched in 2015 with smart contracts. Anyone could create a token and raise millions. Thousands of projects launched. Billions poured into tokens promising to revolutionize everything.
Bitcoin consolidated between $200-400 through 2014-2015. The July 2016 halving passed quietly. Then prices climbed in late 2016.
2017 became absolute mania. Bitcoin went from $1,000 in January to $20,000 in December. Your barber and grandmother asked about Bitcoin. CNBC ran constant crypto coverage. ICOs raised $50-100 million with just whitepapers. Ethereum went from $8 to $1,400. Bitcoin futures launched on CME and CBOE right at the peak.
The Crash: 85% decline to ~$3,000 by December 2018. ICO projects vanished. The SEC cracked down. 2018-2019 became "crypto winter."
Lesson: Altcoin season follows Bitcoin's peak and crashes harder. ICO mania showed speculation detached from value. But Bitcoin's lows ($3,000) were 15x higher than the previous cycle ($200), therefore establishing the "higher lows" pattern.
Third Bull Run (2019-2021)
Halving: May 2020 (12.5 → 6.25 BTC) | Peak: November 2021, ~$69,000 | Gain: ~1,400%
Institutional adoption characterized this cycle. Bitcoin evolved from internet money to a corporate treasury asset.
COVID crashed Bitcoin to $3,800 in March 2020. Central banks unleashed unprecedented stimulus. The Fed printed trillions. Money flooded risk assets.
The May 2020 halving happened as stimulus hit. MicroStrategy bought $250 million in Bitcoin in August 2020. Tesla followed with $1.5 billion. PayPal announced Bitcoin buying. Traditional finance infrastructure built out rapidly.
Retail mania returned, too. DeFi summer 2020, NFT explosion in 2021, Dogecoin rallies. Bitcoin broke $20,000 in December 2020, then kept going: $30K, $40K, $50K, $60K.
Summer 2021 brought a vicious 55% correction, and Bitcoin crashed from $64,000 to $29,000. China banned mining. But it was just mid-cycle. Bitcoin recovered to peak at $69,000 in November 2021.
The Crash: 77% decline to $16,000 by November 2022. Terra/LUNA collapsed ($40 billion gone). Three Arrows Capital blew up. Celsius, Voyager, and BlockFi collapsed. FTX spectacularly imploded, losing billions in customer funds. But Bitcoin stabilized at $16,000, 5x higher than the 2018 low.
Lesson: Institutional adoption didn't prevent crashes. Leverage and fraud amplify downturns. But the network kept running, and prices bottomed higher than in previous cycles.
Pattern Analysis
Percentage gains diminish: First cycle: 10,000%+. Second: ~3,000%. Third: ~1,400%. Law of large numbers - a $1 billion asset can 100x, a $1 trillion asset cannot.
Timing stays consistent: ~13 months (2012→2013), ~17 months (2016→2017), ~18 months (2020→2021) from halving to peak.
Drawdowns remain brutal: 80%+, 85%, 77% declines. Volatility persists despite maturation.
Higher lows: 2015: ~$200. 2018: ~$3,000. 2022: ~$16,000. The floor keeps rising - demonstrating genuine adoption, not just bubbles.
Where Are We Now?

Everything above (the cycle mechanics, historical patterns, bull run characteristics) holds true regardless of when you're reading this. Those are the fundamentals.
What follows is a snapshot of January 2026. Where Bitcoin stands, what the data shows, and the competing scenarios playing out in real time.
But crypto moves fast. If you're reading this a few months down the line, the current situation we're about to describe has probably changed dramatically. Prices shift. Sentiment reverses. New catalysts emerge. That's the nature of the beast.
Anyone claiming certainty about where Bitcoin goes from here is either lying or delusional. What we can do is lay out the competing scenarios and show you the data.
The Current Situation
Bitcoin peaked at $126,210 in October 2025-18 months after the April 2024 halving. Textbook timing. Then it corrected to around $80,000 by early December. As of mid-January 2026, Bitcoin trades between $89,000-$97,000.
Down roughly 25-30% from the peak. Not catastrophic, but not encouraging either.
The Fear & Greed Index sits on the fence 34-40-firmly in "Neutral" territory." Trading volume declined. Retail attention cooled. The mania broke.
But there's a plot twist: ETF inflows resumed in early January. BlackRock's IBIT pulled in $351 million in a single day. Total daily inflows hit $760 million, the largest since October. Institutions are still buying.
Scenario 1: The Bull Run Is Over
Probability: 50-60% (according to historical patterns)
The case is straightforward. Bitcoin peaked 18 months post-halving, matching every previous cycle. The 2013, 2017, and 2021 peaks all came 13-18 months after halvings. October 2025 fits perfectly.
If this holds:
Further decline to $50-70K through 2026
Long consolidation through 2027 (the "boring" phase)
Accumulation resumes late 2027 ahead of the 2028 halving
Next bull run peaks around late 2029
LearningCrypto's perspective: $70K is the line in the sand. As long as Bitcoin holds above this level, the structural bull market remains intact. Break below, and it's a warning sign.
Scenario 2: Mid-Cycle Correction (2026 Leg Up)
Probability: 30-40% (the "this time is different" scenario)
The case: unprecedented institutional infrastructure changes everything. Spot Bitcoin ETFs provide continuous access that didn't exist in previous cycles. This isn't retail gambling - it's pension funds, endowments, and sovereign wealth allocating through traditional channels.
Evidence supporting this:
Luxembourg just allocated 1% of sovereign wealth to Bitcoin (triggering "Sovereign FOMO")
ETF inflows resumed despite the correction
No major exchange failures, fraud events, or regulatory crackdowns
Macro conditions favor Bitcoin: Fed cutting rates, M2 expanding, government debt requiring money printing
Historical precedent exists. The 2013 cycle had a double-top structure. The 2021 cycle saw a brutal summer correction (55% drawdown) before the final November peak.
If this scenario plays out:
Bitcoin consolidates Q1 2026, testing $85-95K range
Resumes rally Q2-Q3 2026
Potential secondary peak at $150-200K before the real bear market begins
The bulls point to the "soft landing is a fairy tale" thesis. The Fed must cut rates not because the economy is healthy, but because the U.S. government can't afford higher rates. Interest payments on the national debt exceed $1 trillion annually, more than defense spending.
When governments print money to service debt, hard assets benefit. Bitcoin included.
Scenario 3: The Wildcard
Probability: 10% (the chaotic variable)
Black swan events break patterns. Regulatory crackdown. Major exchange hack. Competing technology. Macro crisis. War. These aren't predictable, but they happen.
The 2022 Terra/LUNA collapse and FTX implosion weren't in anyone's 2021 forecast. Yet they crashed the market by 77%.
You can't plan for wildcards. You can only manage risk.
What to Watch
$70,000: The floor. Break below, and the structural bull market thesis weakens considerably.
ETF flows: Sustained institutional buying or complete reversal? This is new data we've never had before.
May 2026: Fed Chair Powell's term ends. Political theater around his replacement matters. A "dove" who loves printing money? Bitcoin rips. A "hawk" focused on inflation? Pressure increases.
Volume and volatility: Dead markets don't make bottoms. If volume stays low through Q1-Q2, the consolidation likely extends.
When Is the Next Bull Run Coming?
Now we get to the question in the title that everyone actually wants answered.
The frustrating truth: it depends entirely on whether the current bull run is over.
If October 2025 Was the Peak
Then the next major bull run centers on the 2028 halving, following the established pattern:
Timeline:
2026: Continued consolidation and decline. Prices likely test $50-70K. Media loses interest. Retail exits. "Crypto is dead" narratives return.
2027: Long, boring accumulation phase. Smart money accumulates quietly. Most people stop paying attention entirely.
Late 2027/Early 2028: Anticipation builds ahead of the March/April 2028 halving.
2028-2029: Post-halving bull run accelerates. Prices break 2025 highs.
Late 2029: Potential peak approximately 12-18 months post-halving.
If We're Mid-Cycle
Then the next leg up could begin as early as Q2-Q3 2026, following a pattern similar to 2013 or 2021's mid-cycle corrections.
Timeline:
Q1 2026: Continued consolidation between $85-95K.
Q2-Q3 2026: Rally resumes. Institutional buying accelerates.
Q4 2026/Early 2027: Secondary peak potentially reaching $150-200K.
2027: The actual bear market begins, lasting through 2028.
2028-2029: Fifth halving cycle plays out as normal.
This scenario requires the unprecedented institutional infrastructure (Spot ETFs, sovereign adoption) to override historical timing patterns. It's possible but fighting three cycles of precedent.
The Most Honest Answer
If you're asking "when is the next bull run" in January 2026: We're either in the middle of one that's temporarily correcting, or we just finished one, and the next begins building momentum in late 2027.
If you're reading this later: The 2028 halving is the one certainty. Regardless of what happens in 2026, the March/April 2028 halving will cut supply in half. That mathematical event has triggered every previous bull run. Barring black swans or fundamental Bitcoin failures, it will again create supply pressure.
If the bull run ended in October 2025, the best buying opportunity of this decade is probably coming in 2026-2027. If it hasn't ended, the current correction might be your last chance before higher prices.
Nobody rings a bell at the tops or bottoms. You make your best assessment based on data, manage risk accordingly, and accept that certainty doesn't exist in markets.
Prepare for the Next Bull Run with Real Data
Understanding bull run patterns is one thing. Tracking them in real-time with actionable data is another.
LearningCrypto gives you the tools to actually use this knowledge:
➤ AI-Powered Market Analysis – Ask our AI chatbot about current market conditions, get answers backed by live on-chain data.
➤ Smart-Money Tracking – See what whales and institutions are doing right now.
➤ Real-Time Analytics – Track the on-chain metrics that separate bull runs from bear market rallies.
➤ Professional Portfolio Tools – Monitor your positions with advanced analytics, not basic exchange dashboards.
➤ No Shilling, No Hype – Just data-driven insights from educators with years of experience guiding people through both bull and bear markets.
While others guess, you'll track. While others panic, you'll have data. While others get wrecked by FOMO, you'll see what smart money is actually doing.
Get Started with LearningCrypto
FAQs
How long do crypto bull runs typically last?
12-18 months from halving to peak based on three complete cycles. The 2020-2021 cycle ran approximately 18 months. The 2024-2025 cycle peaked at 18 months in October 2025. However, "typical" doesn't mean guaranteed.
What triggers a crypto bull run?
Bitcoin's halving every four years cuts the new supply 50%, creating a mathematical supply shock. Combined with increasing demand from media attention, institutional adoption, FOMO, and speculative feedback loops, this produces explosive price action. Secondary triggers include regulatory clarity and favorable macro conditions.
Should I buy crypto now or wait for the next bull run?
Depends on risk tolerance and timeline. Dollar-cost averaging during uncertain periods has historically worked well. Waiting for "confirmation" means missing significant early gains.
Can Bitcoin hit $200,000 / $500,000 / $1 million?
$200,000: Plausible within the next cycle or two. $500,000: Requires Bitcoin to become the primary reserve asset for major nations. It’s possible over 5-10 years. $1 million: Needs Bitcoin to replace large portions of gold's market cap; it’s not impossible over 10-20 years, but it requires a very specific adoption trajectory.
Is it too late to get into Bitcoin?
Wrong question. Don't ask whether you missed previous gains. Ask whether Bitcoin will be worth more in 5-10 years than it is today. Bitcoin remains tiny compared to gold ($13T), global stocks ($100T+), or real estate ($300T+).
What's the biggest mistake people make during bull runs?
Arriving late and over-leveraging. They ignore Bitcoin during accumulation, FOMO in after prices doubled, then use leverage and get liquidated during normal 30-40% corrections. Second biggest: no exit strategy - riding it up then down 70-80%. Third: chasing low-cap altcoins that go to zero.
Hard Money Brief
Free Every Week
Hard Money Brief
Free Every Week
Hard Money Brief
Free Every Week
Secure your edge: Get Crypto Made Easy PDF + weekly insights—free today.
No spam, unsubscribe at any time. By subscribing, you agree to our Privacy Policy. Need to unsubscribe? Unsubscribe from newsletter.
Disclaimer: This article is for educational purposes only and does not constitute financial advice. Cryptocurrency investments carry risk; you should always do your own research before making any investment decisions.
Heidi Chakos is co-founder of LearningCrypto and creator of the @cryptotips YouTube channel. A cryptocurrency educator and author with over a decade in the space, she specialises in Bitcoin fundamentals, self-custody, and on-chain analytics. Follow her on X at @blockchainchick.
View all articles →