
The Pi Cycle Top is the most famous single chart in Bitcoin cycle analysis, because for eight years it did something no other indicator did: it flagged the top within days. This guide explains how it works, why it is named after pi, exactly when it fired, the two tops it missed, and how to read it now that its signature crossing has gone quiet.
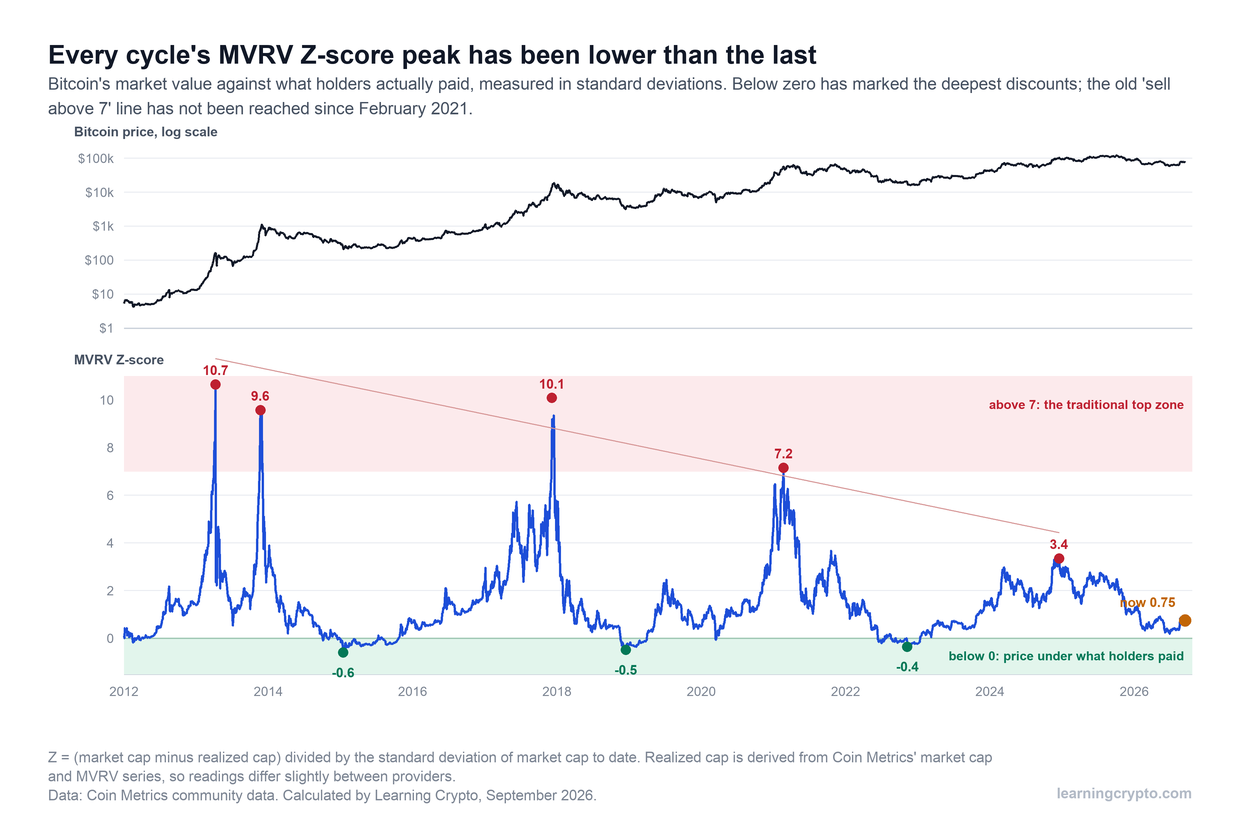
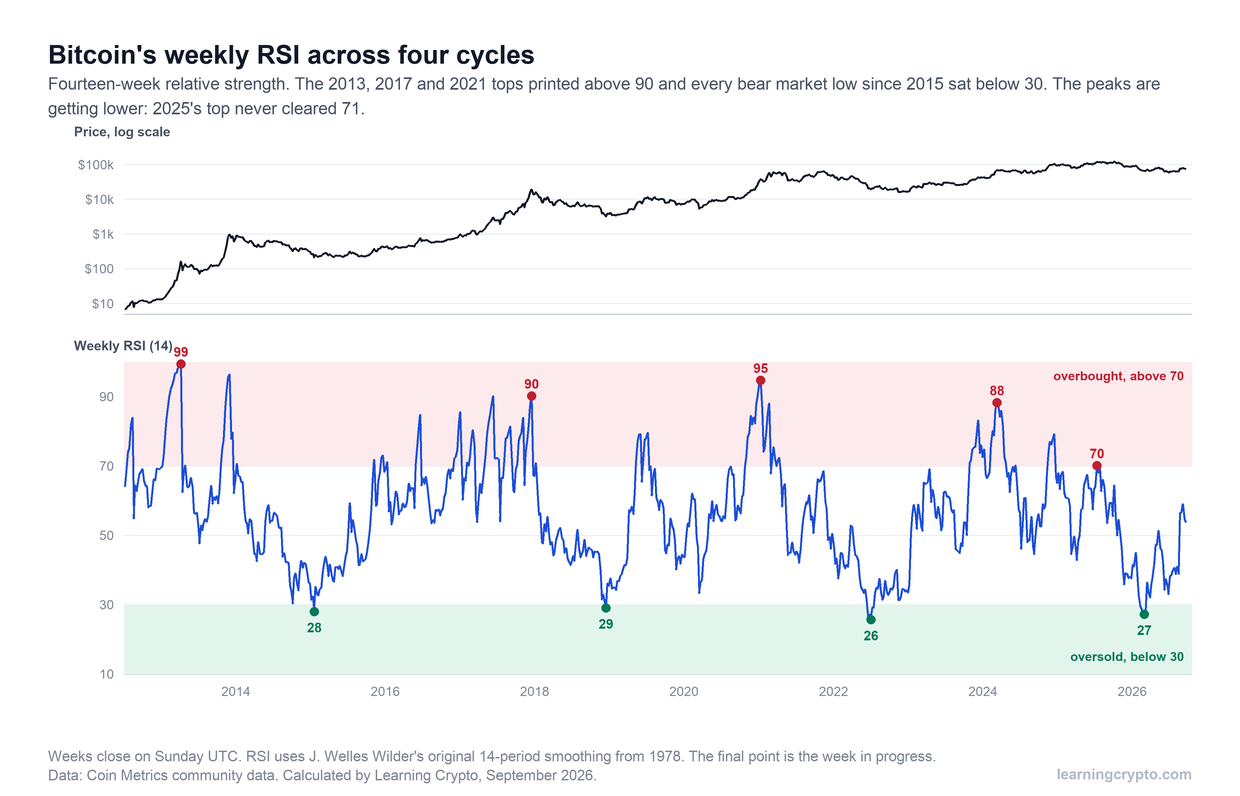
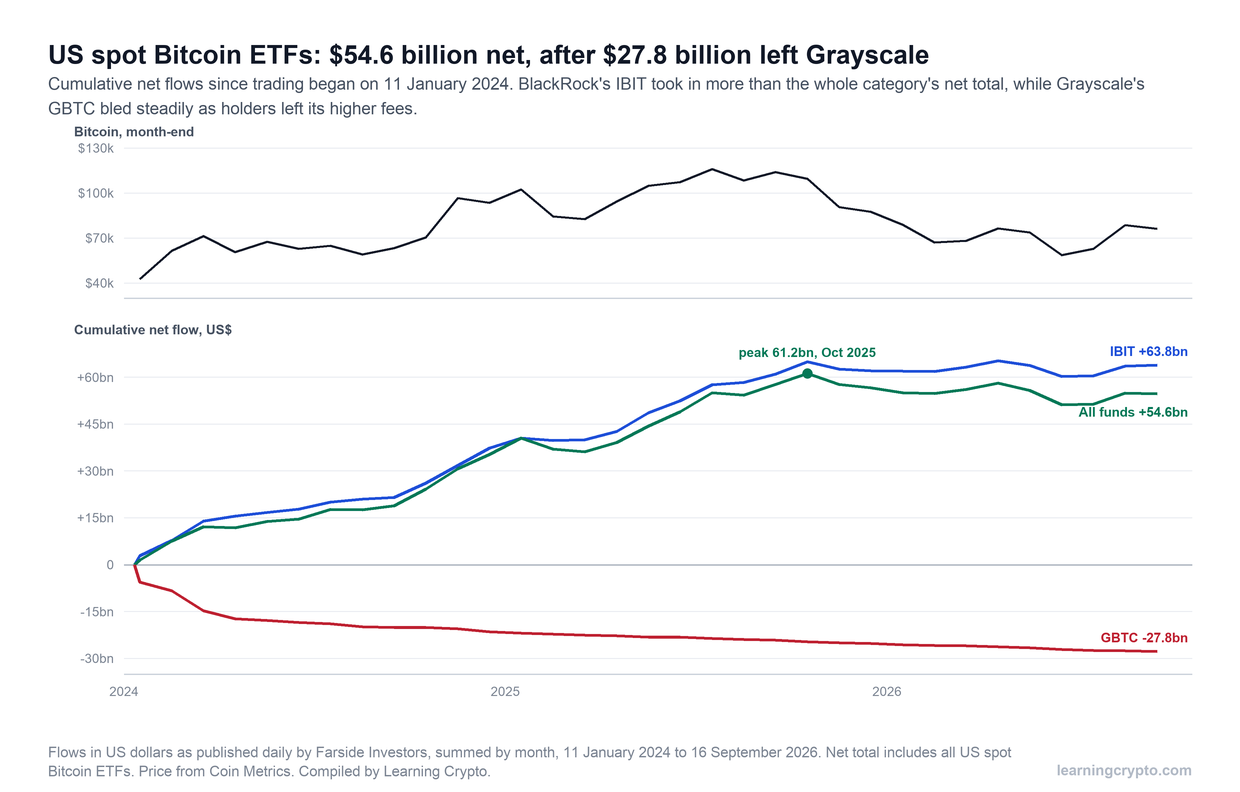
It is part of a five-guide series on the inputs to the Satoshi Indicator. The others cover the MVRV Z-score, weekly RSI, the Crypto Fear and Greed Index and Bitcoin ETF flows.
This is education, not financial advice. The history below describes what happened, not what will happen, and every indicator here has been wrong at least once. Figures were calculated by Learning Crypto from public data in September 2026.
What is the Pi Cycle Top indicator?
It is a pair of moving averages that signals a probable market top when the faster one crosses above the slower one. The fast line is Bitcoin's 111-day simple moving average. The slow line is its 350-day simple moving average, multiplied by two. In a normal market the doubled long average sits well above the short one. When a rally is steep enough to drag the short average above it, the market has historically been close to exhaustion.
The analyst Philip Swift published it in April 2019, and it is still maintained on Bitcoin Magazine Pro, which absorbed his LookIntoBitcoin charts. That date matters when reading its record. Every signal before 2019 is a backtest of a rule fitted to that history. The only live call it has ever made was April 2021.
Why is it called the Pi Cycle?
Because 350 divided by 111 is 3.153, close to pi at 3.142. The name is a curiosity rather than an explanation. Nothing about Bitcoin's cycle depends on pi, and the periods were chosen because they fitted the historical tops, not derived from a theory. That is worth keeping in mind whenever a neat number is offered as evidence that a pattern must continue.
The doubling of the long average does the real work. It sets the crossing at the point where the short-term trend is running at twice the long-term one. That is a way of saying the market has gone parabolic, and parabolic moves in Bitcoin have historically ended within weeks.
How does the Pi Cycle Top work in practice?
Two moving averages, one condition, no judgement required. That simplicity is its appeal and its weakness.
| Component | Calculation | What it represents |
|---|---|---|
| Fast line | Average daily close over the last 111 days | The trend of roughly the last four months |
| Slow line | Average daily close over the last 350 days, times two | A long-term trend with a large margin added |
| The signal | Fast line crosses above slow line | The recent trend has outrun the long one by a historically unsustainable amount |
| The ratio | Fast line divided by slow line | How close the market is to the cross on any given day; 1.0 is the cross |
Because both lines are averages, the signal lags. It cannot fire until a rally has already run for months, which is exactly why it only ever speaks near the end of one. For the same reason it has nothing to say about bottoms, and nothing to say about the months in between. Anyone using it should hold that in mind alongside the ideas in our long-term crypto strategy guide.
Which Bitcoin tops did the Pi Cycle catch?
Four, from 2013 to 2021, each within days of the first top of its cycle.
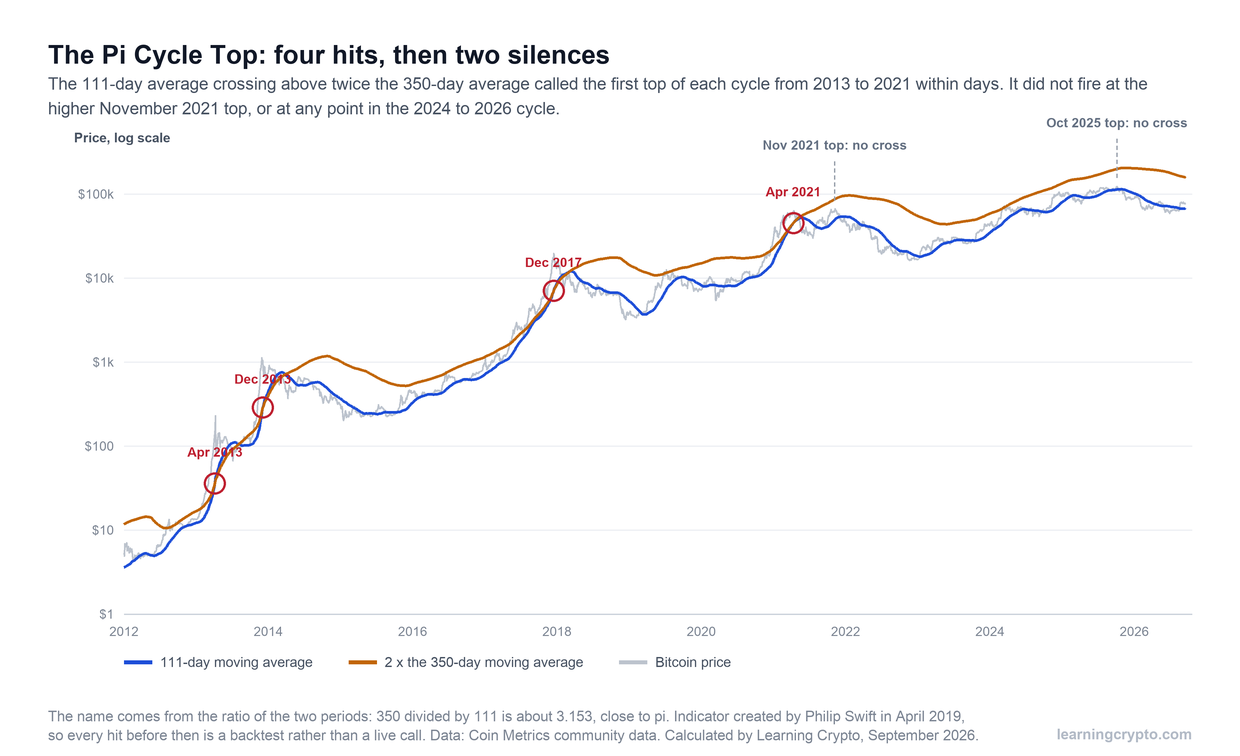
Four crossings, each within days of a cycle's first peak. Then two tops with no signal at all: the higher November 2021 high, and the whole of the cycle that peaked in October 2025.
| Crossing | Price that day | Highest close nearby |
|---|---|---|
| 6 April 2013 | $143 | $231 on 9 April 2013 |
| 5 December 2013 | $1,027 | The same day |
| 16 December 2017 | $19,641 | The same day |
| 12 April 2021 | $59,906 | $63,446 on 13 April 2021 |
No other single indicator has a record that close. In two cases the crossing came on the exact day of the highest close, and in the other two within three days. The April 2021 call is the one to weight most heavily, because it was made live, two years after the indicator was published.
Which tops did it miss, and why?
Two, and they are why no one should treat it as a switch any more. It did not fire at the November 2021 high of $67,542, which was higher than the April top it had just called. And it did not fire at all in the cycle that peaked on 6 October 2025 at $124,824, the highest close in Bitcoin's history.
The November 2021 miss has a clear cause. After April's crash the 111-day average fell sharply, and the rally back to a new high was too slow to lift it anywhere near the line. The ratio peaked at only 0.58. The market made a higher price without making a steeper one, and the indicator measures steepness.
Across the 2024 to 2026 cycle, the same thing happened at larger scale. The run to $124,824 was spread over nearly two years, with a long pause in 2024 and a second leg in 2025. The ratio's highest reading of the cycle came in June 2024 at 0.74, and on the day of the top it was 0.57. A cycle without a single parabolic month gives this indicator nothing to catch.
The deeper point is about fitting. Two moving-average lengths chosen to match three historical peaks will match those peaks. Whether they match the next one depends on whether the next cycle has the same shape, and Bitcoin's cycles have been getting longer and flatter, as our guide to crypto bull runs discusses.
How do you read the Pi Cycle as a ratio?
Divide the fast line by the slow line and plot the result every day. Instead of a single event every four years, you get a continuous reading of how stretched the market is, and you can see how close each cycle came even when it never crossed.
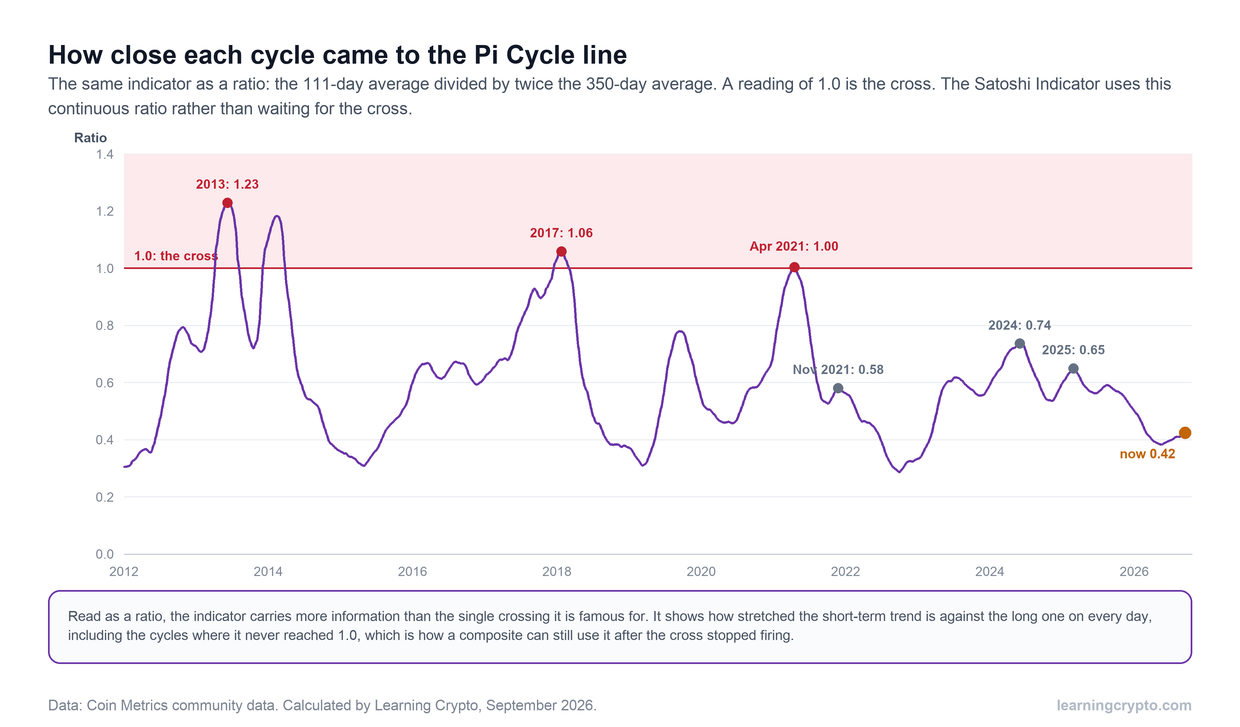
The same indicator read as a ratio. It shows how close each cycle came to the line, which the binary crossing hides, and it is the form a composite can keep using after the cross stopped firing.
Read this way, the history is more informative. Each cycle's peak ratio has been lower than the last: 1.23 in 2013, 1.06 in 2017, exactly 1.00 in April 2021, then 0.74 and 0.65 in the latest cycle. That is the same shrinking-peaks pattern visible in the MVRV Z-score, arrived at from price alone. In mid-September 2026 the ratio stood at 0.42, near the low end of its range and a long way from anything that has looked stretched.
A sensible way to use it now:
- Compare the ratio with this cycle's own peaks, not with 1.0. A reading back above 0.7 would be as stretched as the market has been since 2021.
- Treat a rising ratio as heat, not as a countdown. It describes the pace of a rally, which is useful for deciding how much to keep adding.
- Never use it for bottoms. A low ratio says the market is not overheated. It says nothing about how far a decline has left to run.
Is there a Pi Cycle bottom indicator?
There are several, built on the same idea with different moving averages, and they have a weaker record than the top version. Bottoms in Bitcoin have been long and flat rather than sharp, which is hard terrain for any crossover signal. If you want a measure of whether the market is cheap, a valuation measure such as the MVRV Z-score, or a momentum measure such as the weekly RSI, has a clearer history. For building a position through a low without guessing the day, a disciplined dollar-cost averaging plan does more than any crossover.
How does the Satoshi Indicator use the Pi Cycle?
As the continuous ratio, carrying 25% of the composite. It does not wait for the cross. The daily ratio is smoothed with a 14-day moving average, scaled to 0 to 100 against its own history, and blended with the MVRV Z-score, weekly RSI, Fear and Greed and ETF flows.
That design is a direct response to the misses above. A binary crossing gives no information in a cycle that never crosses. A ratio still registers a rally as warm at 0.7 even if it never reaches 1.0, and the other inputs can agree or disagree with it. The full method, including what the indicator cannot do, is on the Satoshi Indicator page, and the daily reading is included in the Navigator plan. The raw price data used in this guide is from Coin Metrics' community data. For more on reading cycles, see the Analysis hub, and for the broader toolkit, our on-chain analysis guide.
Frequently asked questions
What is the Pi Cycle Top indicator?
It is a Bitcoin market-top signal made of two moving averages: the 111-day average and twice the 350-day average. When the 111-day line crosses above the doubled 350-day line, the market has historically been close to a peak. Philip Swift published it in April 2019, and it matched the 2013, 2017 and April 2021 tops within three days.
Why is it called the Pi Cycle?
Because 350 divided by 111 is about 3.153, close to the value of pi. The name is a coincidence of the chosen periods, which were picked because they fitted Bitcoin's historical tops, not derived from any property of pi. The doubling of the 350-day average is what actually sets the signal.
Did the Pi Cycle Top indicator work in 2021?
Partly. It crossed on 12 April 2021, a day before that spring's highest close of $63,446, which was its only live call. It did not fire at the higher November 2021 top of $67,542, because the second rally was too gradual to lift the 111-day average near the line. The ratio peaked at only 0.58.
Did the Pi Cycle Top trigger in 2025?
No. Bitcoin's highest close of the cycle came on 6 October 2025 at $124,824, and the Pi Cycle ratio was 0.57 that day. Its highest reading of the entire 2024 to 2026 cycle was 0.74 in June 2024. The rally was spread over nearly two years without a parabolic phase, so the crossover never came close.
Is the Pi Cycle Top indicator still reliable?
Not as a standalone switch. It caught four tops, three of them in backtest, and missed the last two. As a continuous ratio it remains useful for gauging how stretched a rally is, especially if you compare readings with the current cycle's own peaks rather than waiting for the 1.0 crossing that recent cycles have not reached.
What is the Pi Cycle ratio today?
On 16 September 2026, calculated from Coin Metrics prices, the 111-day average was 0.42 times the doubled 350-day average. That is near the bottom of its historical range and well below this cycle's peak of 0.74, which describes a market that is not stretched. It says nothing about whether prices will rise or fall next.
This guide is part of stage 7 of 8, reading the market, in the free Learning Crypto curriculum. Next: Bitcoin Weekly RSI: What It Shows About Cycle Tops and Bottoms.
Keep learning
- MVRV Z-Score Explained: How to Read Bitcoin's Most Watched Valuation Metric
- Bitcoin Weekly RSI: What It Shows About Cycle Tops and Bottoms
- Crypto Fear and Greed Index: What It Measures and What Its Record Shows
- Bitcoin ETF Flows Explained: What the Daily Numbers Mean for Price
- What Is a Crypto Bull Run and When Is the Next One Coming?
- How the Satoshi Indicator combines all five
- More guides in the Analysis hub