
The relative strength index is one of the oldest tools in technical analysis, and on a daily chart it is mostly noise. On Bitcoin's weekly chart it becomes something else: one of the cleanest records of cycle extremes available. This guide explains how RSI is calculated, what the weekly version read at every Bitcoin top and bottom since 2013, why the weekly period matters so much, and the divergence pattern that appeared before the last two major lows.
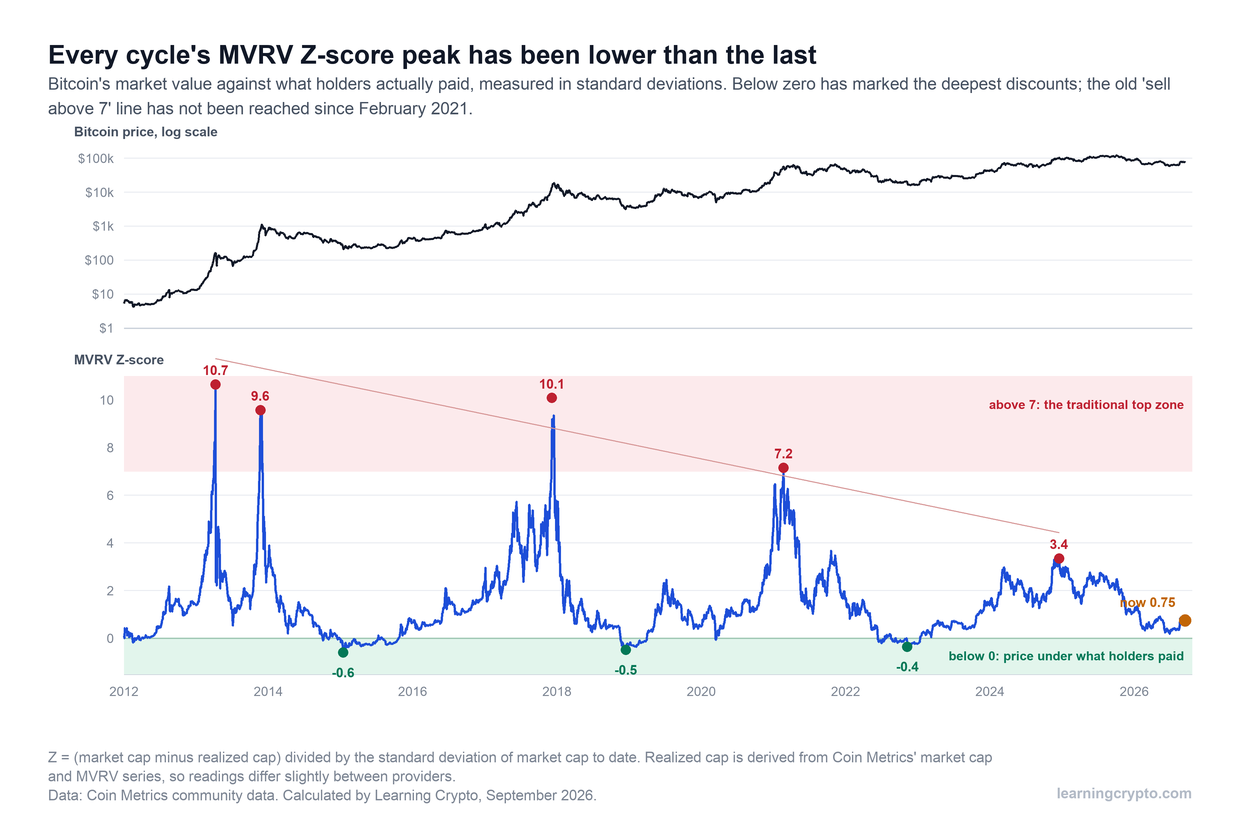
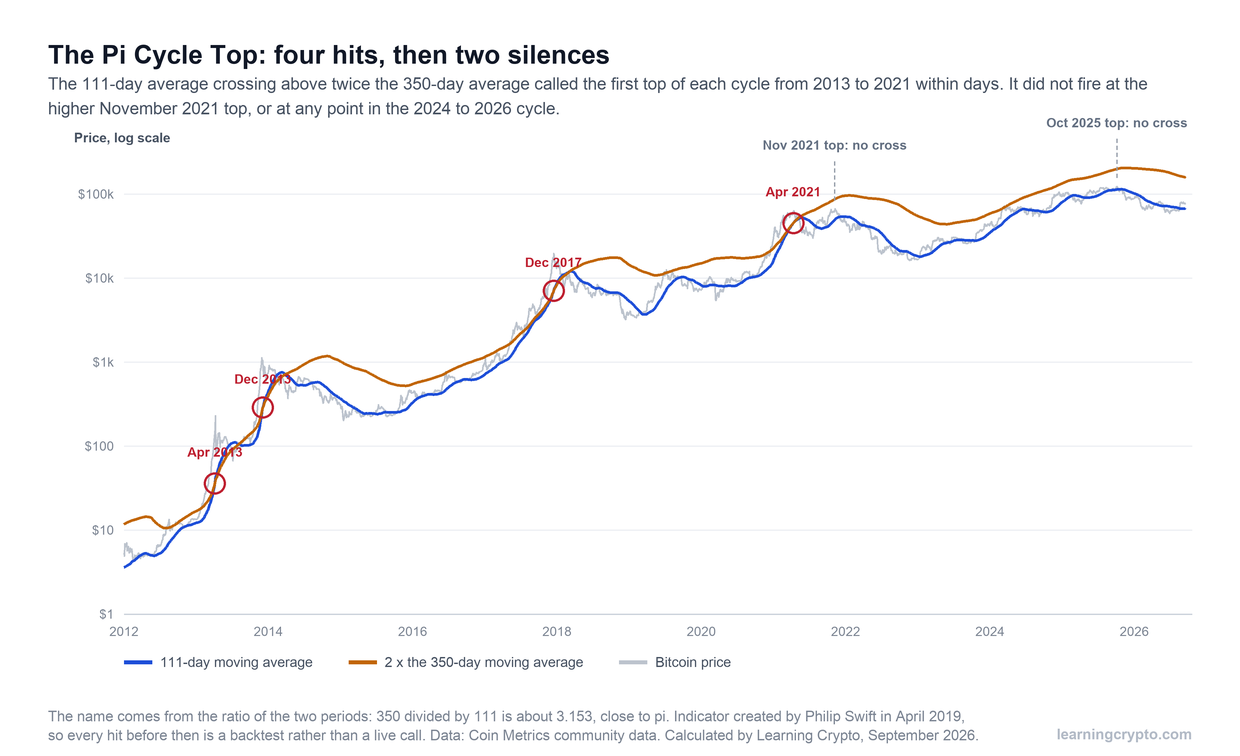
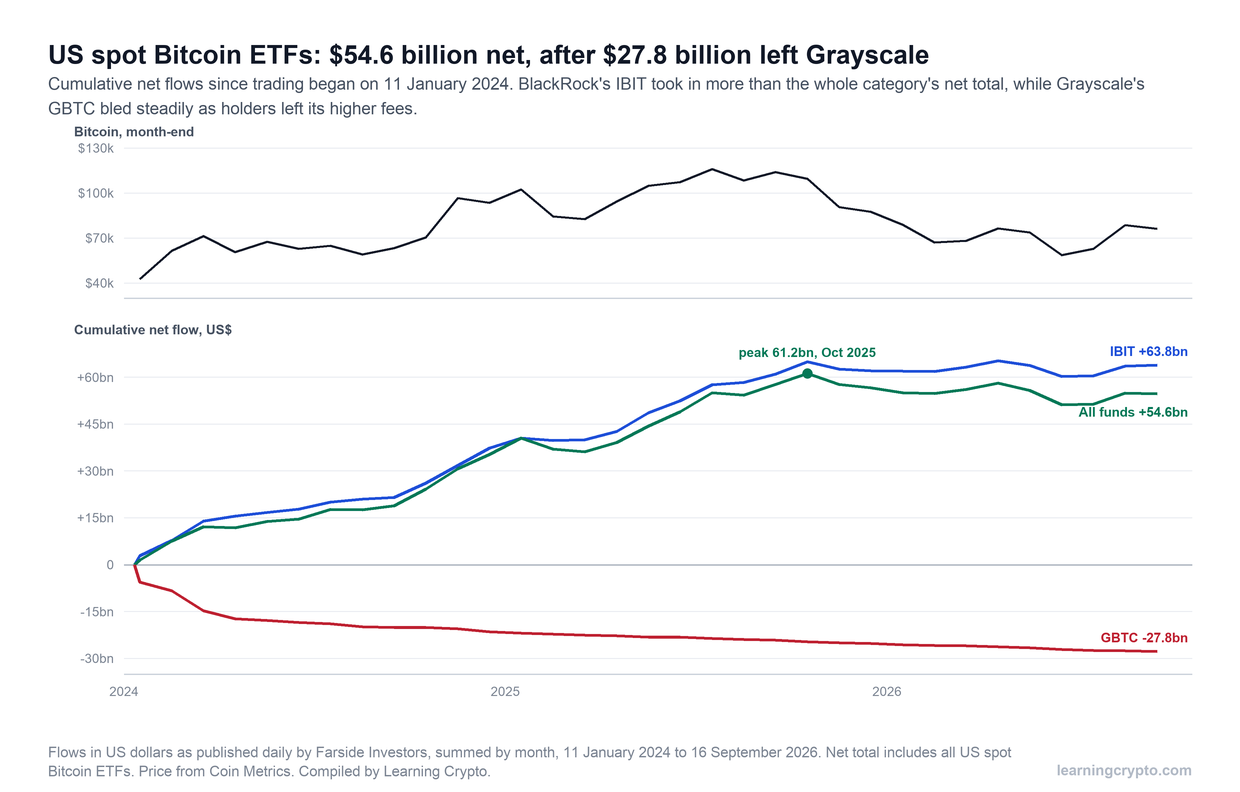
It is one of five guides to the inputs behind the Satoshi Indicator. The other four explain the MVRV Z-score, the Pi Cycle Top indicator, the Fear and Greed Index and spot Bitcoin ETF flows.
This is education, not financial advice. The history below describes what happened, not what will happen, and every indicator here has been wrong at least once. Figures were calculated by Learning Crypto from public data in September 2026.
What is the relative strength index?
RSI measures the balance between recent gains and recent losses on a scale from 0 to 100. A reading above 50 means gains have outweighed losses over the period. Above 70 is conventionally called overbought and below 30 oversold. J. Welles Wilder Jr. introduced it in his 1978 book New Concepts in Technical Trading Systems, and the 14-period version he proposed is still the standard.
The important word is momentum. RSI says nothing about whether an asset is cheap or expensive, only about how forcefully it has been moving. That makes it a different kind of evidence from the valuation measures in this series, and it is why it is worth having alongside them.
How is RSI calculated?
In three steps, each simple. StockCharts' ChartSchool reference walks through a worked example if you want to check the arithmetic.
- Split each period's change into a gain or a loss. A week that closed $2,000 higher is a gain of 2,000 and a loss of zero.
- Average them with Wilder's smoothing. The first average is the plain mean of 14 periods. After that, each new average keeps 13 parts of the old one and adds 1 part of the new value, so recent weeks matter more but old ones fade gradually.
- Convert to a 0 to 100 scale. Divide average gain by average loss to get relative strength, then RSI equals 100 minus 100 divided by one plus that ratio.
Two consequences follow from the smoothing. RSI rarely reaches its extremes, because it takes a long run of one-sided weeks to push it there. And different charting tools can show slightly different readings for the same week, depending on whether they use Wilder's smoothing or a simple average, and on which day the week closes. Our figures use Wilder's method and weeks ending Sunday UTC.
What has Bitcoin's weekly RSI shown at tops and bottoms?
A consistent floor and a falling ceiling. Every major low since 2015 printed a weekly RSI between 25 and 30, and the first three cycle tops printed above 90. The most recent two tops printed lower each time.
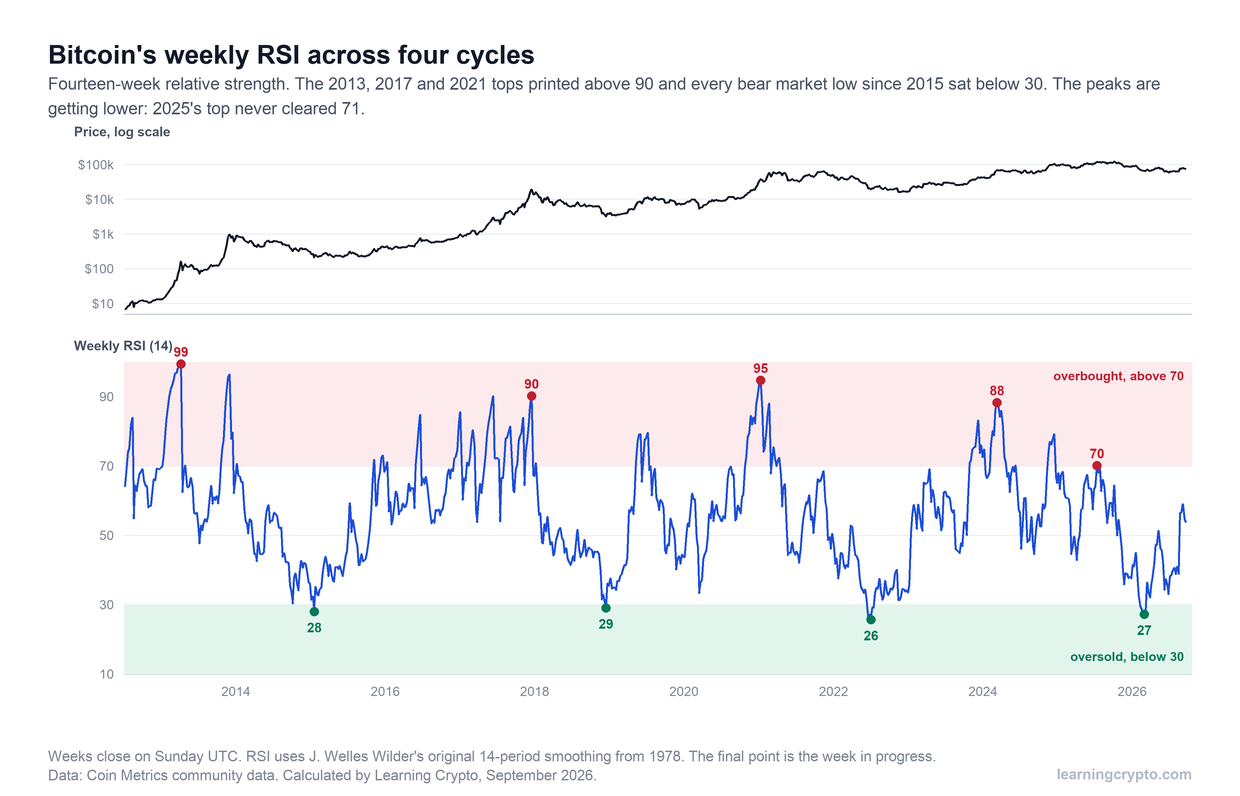
The four lows sit in a tight band between 26 and 29. The peaks have fallen from above 90 to 88 in 2024 and 70 in 2025, which is the same shrinking pattern the valuation measures show.
| Moment | Weekly RSI | Week ending |
|---|---|---|
| 2013 peak | 99.4 | 7 April 2013 |
| 2015 low | 28.0 | 18 January 2015 |
| 2017 peak | 90.2 | 17 December 2017 |
| 2018 low | 29.0 | 16 December 2018 |
| 2021 peak | 94.7 | 10 January 2021 |
| 2022 low | 25.7 | 3 July 2022 |
| 2024 peak | 88.3 | 10 March 2024 |
| 2025 peak | 70.1 | 13 July 2025 |
| 2026 low | 27.2 | 1 March 2026 |
Readings below 30 are genuinely rare. Across the whole history there have been only twelve weekly closes under 30, clustered in four episodes. Readings above 90 have been more common, 26 weeks in total, almost all in the three explosive cycles before 2021. In the seven weeks under 30 that have a full year of price data after them, Bitcoin was higher a year later every time, by a median of 46%. That is a small sample, and it should be read as a description rather than a promise.
Notice that the 2025 cycle top, Bitcoin's highest close in October 2025, came with the weekly RSI at 64, below its July reading of 70. Momentum was already fading as price made its final high. That kind of disagreement is the subject of the next two sections.
Why use the weekly chart instead of the daily one?
Because a 14-day RSI on a market that routinely moves 5% in a day flips between overbought and oversold constantly. The same calculation over 14 weeks averages out the noise and only reaches its extremes when a move has lasted for months.
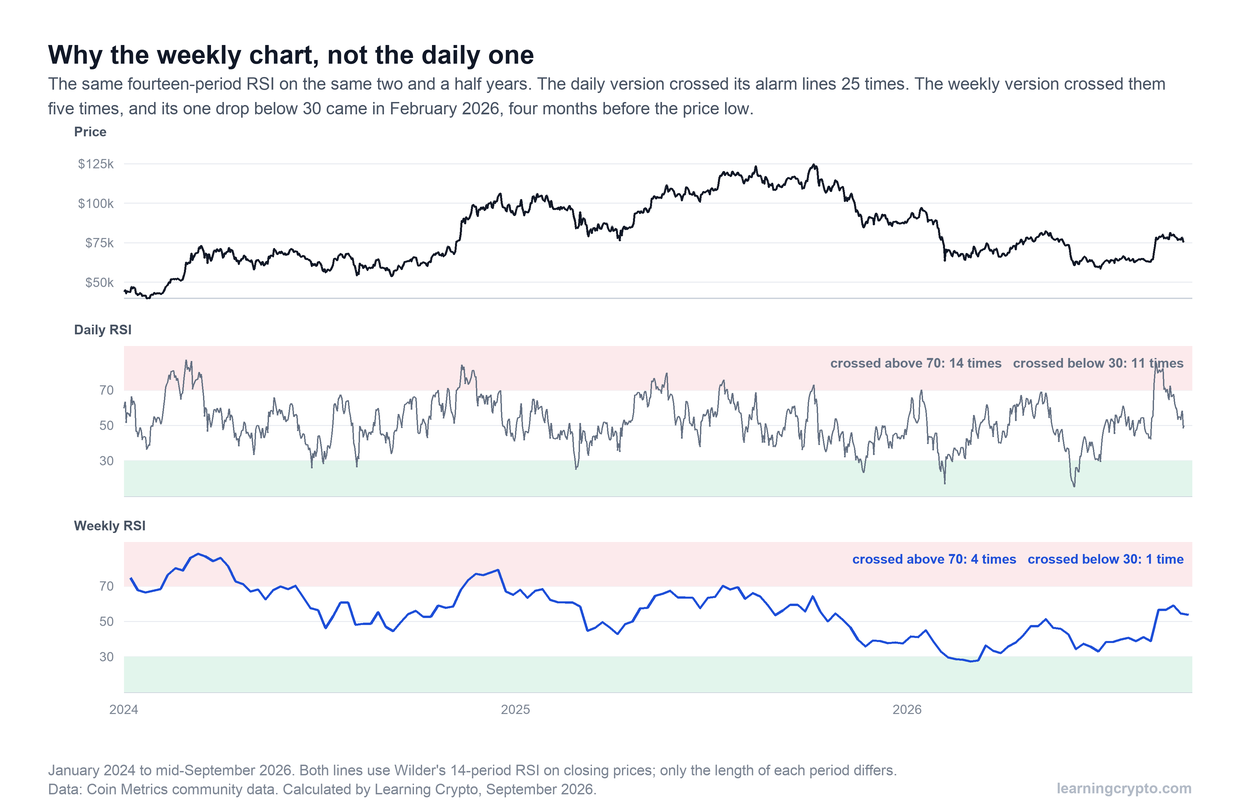
Same formula, same data, different period length. The daily line produced 25 alarms in under three years; the weekly line produced five, and its single oversold reading came during the February 2026 sell-off.
Over January 2024 to mid-September 2026 the daily RSI crossed above 70 fourteen times and below 30 eleven times. The weekly RSI crossed above 70 four times and below 30 once. A trader acting on every daily alarm would have bought and sold twenty-five times into a market that finished the period roughly where the weekly chart suggested it would. That is the difference between a timing tool and a regime tool, and it is the same reason our guide to spot trading warns against reacting to every signal on short timeframes.
The daily chart is not useless. Traders using leverage watch it because their horizon is days, not years. For anyone accumulating over a cycle, the weekly chart is the one that carries information.
What is RSI divergence, and why did it matter in 2022 and 2026?
Divergence is when price and RSI disagree: price makes a new low while RSI makes a higher low, or price makes a new high while RSI makes a lower high. It says the move is continuing with less force behind it. On Bitcoin's weekly chart, the bullish version has appeared before the last two major lows.
| Cycle | Oversold reading | Later price low | RSI at the later low |
|---|---|---|---|
| 2022 | 25.8 with Bitcoin at $19,277, early July | $16,247, late November | 31.3 |
| 2026 | 27.2 with Bitcoin at $65,734, early March | $59,517, late June | 33.0 |
In both cycles, the first plunge pushed the RSI below 30 and felt like capitulation. Price then drifted lower for four more months, but did so slowly enough that RSI stayed above its earlier low. The final low arrived with less selling pressure than the first, which is what the higher RSI records. In 2018 there was no divergence: the lowest RSI and the lowest price came in the same week of December.
The practical lesson is uncomfortable for anyone who bought the first oversold reading with all their cash. A weekly RSI below 30 has been a good time to start buying, not a sign the low was in. Spreading purchases across the months that follow, as in a DCA plan, has handled both cases. For the role of volume in confirming these moves, see our guide on what volume means in crypto.
How should you read the weekly RSI today?
In mid-September 2026 the weekly RSI read about 54, in the middle of its range, after rising from the 2026 low. That describes a market with modestly more buying than selling over the past three months, and nothing more.
- Use 30 as a zone, not a trigger. Readings there have marked the region of every low since 2015, but the price low has come up to four months later.
- Adjust the top threshold to the cycle. With peaks falling from 99 to 70, a reading in the high 60s now deserves the attention 90 once did.
- Look for divergence at extremes. A new price high with a lower weekly RSI, or a new low with a higher one, has been more informative than the level alone.
- Pair it with valuation. Momentum and value disagree often. A low RSI with a low MVRV Z-score is a stronger case than either on its own.
How does the Satoshi Indicator use weekly RSI?
As 20% of the composite. The weekly RSI is smoothed with a 14-day moving average, scaled to 0 to 100 against its own history, and combined with the MVRV Z-score, the Pi Cycle ratio, the Fear and Greed Index and ETF flows. The blended reading maps to a temperature zone and to a multiplier that raises or lowers the size of each DCA purchase.
Giving momentum its own seat alongside valuation is deliberate. Valuation tells you whether prices are high relative to what holders paid. Momentum tells you whether the market is still running. The two agreeing is when the composite moves most. The method and its limits are documented on the Satoshi Indicator page, the live reading is part of the Navigator plan, and the price data used here is from Coin Metrics' community data. More guides on reading markets are in the Analysis hub, and our long-term strategy guide covers how to fit tools like this into a plan.
Frequently asked questions
What is a good weekly RSI to buy Bitcoin?
Historically, weekly readings below 30 have marked the region of every major low since 2015, and Bitcoin was higher a year later after each such week with enough data to judge. The catch is timing: in 2022 and 2026 price kept falling for about four months after the first reading under 30, so it has worked better as a zone to start buying than as a single entry.
What did the weekly RSI show at the 2021 top?
The weekly RSI peaked at 94.7 in the week ending 10 January 2021, well before the April and November price highs. By the November 2021 top it was about 68, a clear bearish divergence: price made a new high while momentum made a lower one. The market then fell 77% to its November 2022 low.
Why is the weekly RSI better than the daily RSI for Bitcoin?
Because Bitcoin's daily moves are large enough to push a 14-day RSI into overbought or oversold territory every few weeks. From January 2024 to September 2026 the daily RSI crossed 70 or 30 twenty-five times, against five times for the weekly RSI. The weekly version only reaches its extremes when a move has persisted for months.
What is bullish RSI divergence?
It is when price makes a lower low but RSI makes a higher low, showing that the decline is continuing with less force. On Bitcoin's weekly chart it appeared before the lows of November 2022 and June 2026: in both cases RSI had bottomed months earlier below 30, and the final price low came with RSI above 30.
What does an RSI above 70 mean for Bitcoin?
Gains have strongly outweighed losses over the period. On a weekly chart it has marked every major bull phase, but it can stay above 70 for months, so it is not a sell signal by itself. Readings above 90 came at the 2013, 2017 and early 2021 extremes, while the 2025 top peaked at just 70.
What is Bitcoin's weekly RSI right now?
In mid-September 2026, using Wilder's 14-week calculation on Coin Metrics prices with weeks ending Sunday, it was about 54, up from 27 at the start of March. That is a neutral reading. The final value for any week can shift until the week closes, so check a live chart before relying on it.
This guide is part of stage 7 of 8, reading the market, in the free Learning Crypto curriculum. Next: Crypto Fear and Greed Index: What It Measures and What Its Record Shows.
Keep learning
- MVRV Z-Score Explained: How to Read Bitcoin's Most Watched Valuation Metric
- The Pi Cycle Top Indicator: How It Works, What It Caught and What It Missed
- Crypto Fear and Greed Index: What It Measures and What Its Record Shows
- Bitcoin ETF Flows Explained: What the Daily Numbers Mean for Price
- What Is DCA in Crypto? Your Complete Guide to Dollar Cost Averaging
- How the Satoshi Indicator combines all five
- More guides in the Analysis hub