
The Satoshi Indicator is Learning Crypto’s daily Bitcoin dollar-cost-averaging signal. In the member app it appears as The Satoshi Thermometer: a 0–100 market-temperature reading built from five weighted inputs (MVRV-Z, Pi Cycle, weekly RSI, Fear & Greed, and ETF flow). The print maps to a zone from Deep Value through Overheated and to a continuous DCA multiplier. The live daily reading is included on the Navigator plan ($899/yr).
| What it is | Daily Bitcoin DCA signal (market temperature, 0–100) |
|---|---|
| What it measures | MVRV-Z (25%), Pi Cycle (25%), weekly RSI (20%), Fear & Greed (15%), ETF flow (15%) |
| Output | Score 0–100 with six zones: Deep Value (<20), Cool (<40), Neutral (≤55), Warm (≤70), Hot (≤85), Overheated (>85), plus a continuous DCA multiplier |
| Update frequency | Daily, around 06:00 UTC |
| Available on | Navigator plan, $899/yr — See pricing |
| First published | Member feature; this page August 2026 |
| Last reviewed | August 26, 2026 |
| Maintained by | Heidi Chakos |
How it works
The Satoshi Indicator is a DCA regime tool. It answers whether conditions favour stacking Bitcoin, running a standard allocation, or cutting new buys — not where price prints tomorrow.
Inputs
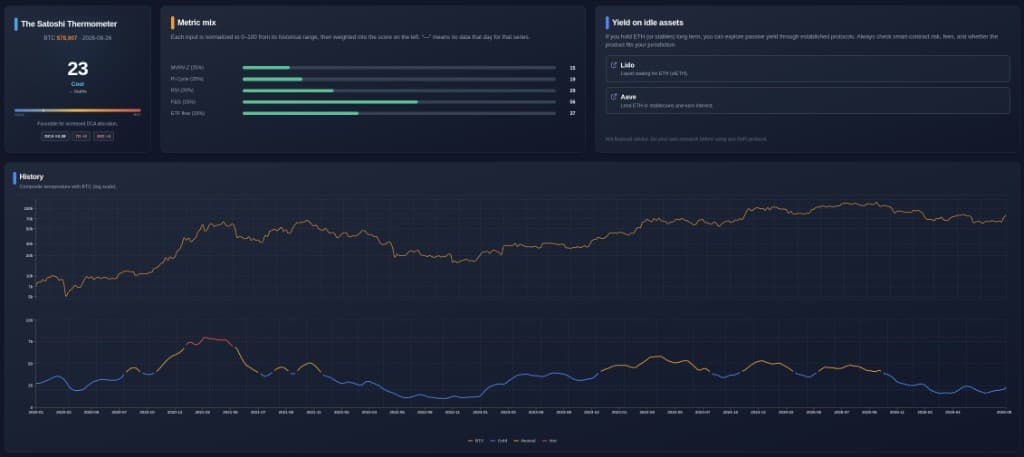
Five series, shown in the app as the Metric mix: MVRV-Z (25%), Pi Cycle (25%), weekly RSI (20%), Fear & Greed (15%), and ETF flow (15%). ETF flow is included only from 1 January 2024; earlier days reweight the remaining inputs.
Weighting
Each input is smoothed with a 14-day EMA, then normalized to 0–100 from its historical range. The composite is the weighted average of available inputs that day, smoothed with a 21-day EMA, and clipped to 0–100. Missing series (shown as “—” in the app) drop out and the weights of the rest are renormalized.
Bands
Deep Value below 20, Cool below 40, Neutral through 55, Warm through 70, Hot through 85, Overheated above 85. A separate 30-day trend label (Heating, Warming, Stable, Cooling, Crashing) sits under the zone.
DCA multiplier
Sizing uses ((100 − temperature) / 50)². At 50 the multiplier is 1× (standard DCA). Cooler readings raise it (up to 4× at 0); hotter readings cut it toward 0×. Members see this on the thermometer (for example DCA ×2.56). Satoshi DCA, on the same page in the app, backtests that dynamic size against a fixed weekly or monthly buy.
Live reading on Navigator: $899/yr. 30-day money-back guarantee.
See pricingWhat it does not do
- It is not a short-term trading signal and is not built to time intraday entries.
- It does not replace custody, position sizing, or your own research.
- ETF flow only enters from January 2024; a missing input that day shifts weight onto the rest.
- It is educational context, not advice, and the reading can be wrong.
- This page does not publish a live series — the daily print remains Navigator-only.
What it showed at key moments
The History panel in the member app plots the composite temperature against Bitcoin on a log scale from January 2020. Cold (blue) prints cluster in deep drawdowns; hot (red) prints cluster near cycle extensions. The screenshot above is a static capture of that series. Dated event-by-event readings stay on the live chart rather than a hand-typed table on this page.
How it compares
Pi Cycle Top is a moving-average crossover aimed at cycle tops. Satoshi does not replace it: Pi Cycle is 25% of the composite (the 111-day / 350-day ratio), then mixed with four other series and smoothed.
MVRV Z-score measures market value versus realised value. It is also 25% of the Satoshi mix, not a rival oscillator. Satoshi’s job is a daily DCA stance, not a single-top call or a standalone valuation z-score.
Satoshi DCA is a backtest on the same dashboard: fixed weekly or monthly buys versus dynamic buys sized by the thermometer multiplier. It is a historical comparison, not a live execution engine.
The live daily Satoshi Indicator reading is included on the Navigator plan at $899/yr (or $99/mo).
Related guides
Access and pricing
See all plans. New members get a 30-day money-back guarantee.